Economic Data Creates Confusion
The January Personal Consumption Expenditure (PCE) report released last week surprised Wall Street and put a halt to the current rebound after February pullbacks. In a nutshell, inflation, following the last consumer price index (CPI) and producer price index (PPI) reports, came in higher than economists had hoped indicating that inflation has proven more resilient than the monetary policy the Fed has implemented in order to tame the inflation beast. The Fed had indicated that they would raise rates another 25 basis points at the March meeting and then sit back and access what effect, if any, their policy is having on inflation.
Now everybody is wondering if the Fed will raise rates 50 basis points instead of 25, or will they stick to their original plan? Wall Street does not like the uncertainty and has reacted by selling off stocks the last several days. Chasing all this data and trying to predict the next move can get very frustrating and confusing.
At times like this, instead of focusing on economic data and trying to guess what the Fed and Wall Street will do next, I like to focus on the basics. This is where technical analysis can tell the story without emotion or bias and removes some of the noise.
Price Tells the Story
If you’ve been around investing for any length of time, you’ve heard the phrase “buy low, sell high,” which simply means buy a stock when its price drops and sell it after the price goes up. The problem is, how do you know when the price has stopped going down and when has the price peaked? For short-term traders, this principle can work if you have a trading system that can react quickly and limit losses. But for long-term investors, a better way to think about it is to examine the trends in the market and focus on buying strength and selling weakness within those trends. But first you have to know which way the trend is going.
Higher Highs, Higher Lows
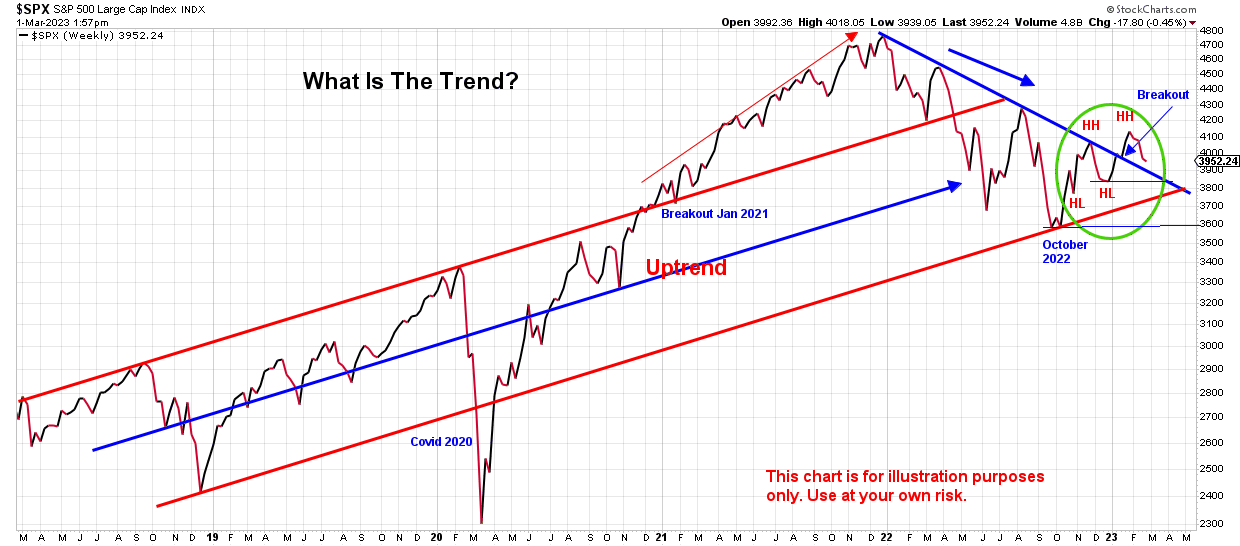
Since prices are constantly moving up and down in the market, we can use another simple principle of investing that says we want to see higher highs (HH) and higher lows (HL) in the price of whichever index or stock we are interested in to determine if it is in an uptrend.
By looking at the 5-year weekly chart below, you can see that the S&P 500 has been in an uptrend for at least the last five years. In March of 2020, the index broke down through the trend for about two weeks due to Covid issues but came right back. In early 2021, the index broke through the top of the trend line and was strong for most of the year. In January of 2022, the index peaked and began trending down through most of the year, but it stayed within the longer-term uptrend.
On the far right, within the green circle, you can see what occurred in October of 2022. While at the bottom of the larger uptrend, the index started up and began making a series of higher highs (HH), and higher lows (HL). At the time, we don’t know if the index will break out of the 2022 correction or if it will turn back down like it had all year. Finally, in January 2023, the index broke out of the correction and reached a higher high. There are a few things to look for now to determine whether or not it can stay in this smaller uptrend that started in October. These include:
- Will the index make a higher low anytime soon and stay in the short-term uptrend?
- If #1 fails, will the price stay above the previous higher low at approximately 3840?
- If #2 fails, will the price find support at 3600—the October low?
- Breakdown below 3600 could indicate that this uptrend is over.
In the next few weeks, we should be able to answer these questions and clear up some of the uncertainty we currently face. Price is the only thing we know for certain, and using the higher high and higher low formula helps clear the noise that surrounds price and allows us to ask the right questions that can lead to making better decisions.
*****
This post is for informational purposes only. It is not intended as investment advice as each person’s financial situation is different. I strongly recommend working with a financial advisor who can deliver current information to you quickly and offer help with sorting through the various investing options. Bret Wilson is a Financial Advisor with Wilson Investment Services, based in Rockwall, Texas.