Toward the end of October and into early November 2025, the market started showing some subtle signs of weakness. At the time, you probably wouldn’t have guessed it—especially since the S&P 500 went on to hit an all-time high at the end of January 2026.
But if you looked a little deeper, there were already hints that momentum was starting to fade.
Early Signs of a Shift
If you were watching closely, a few key indicators were quietly signaling that something was changing beneath the surface.
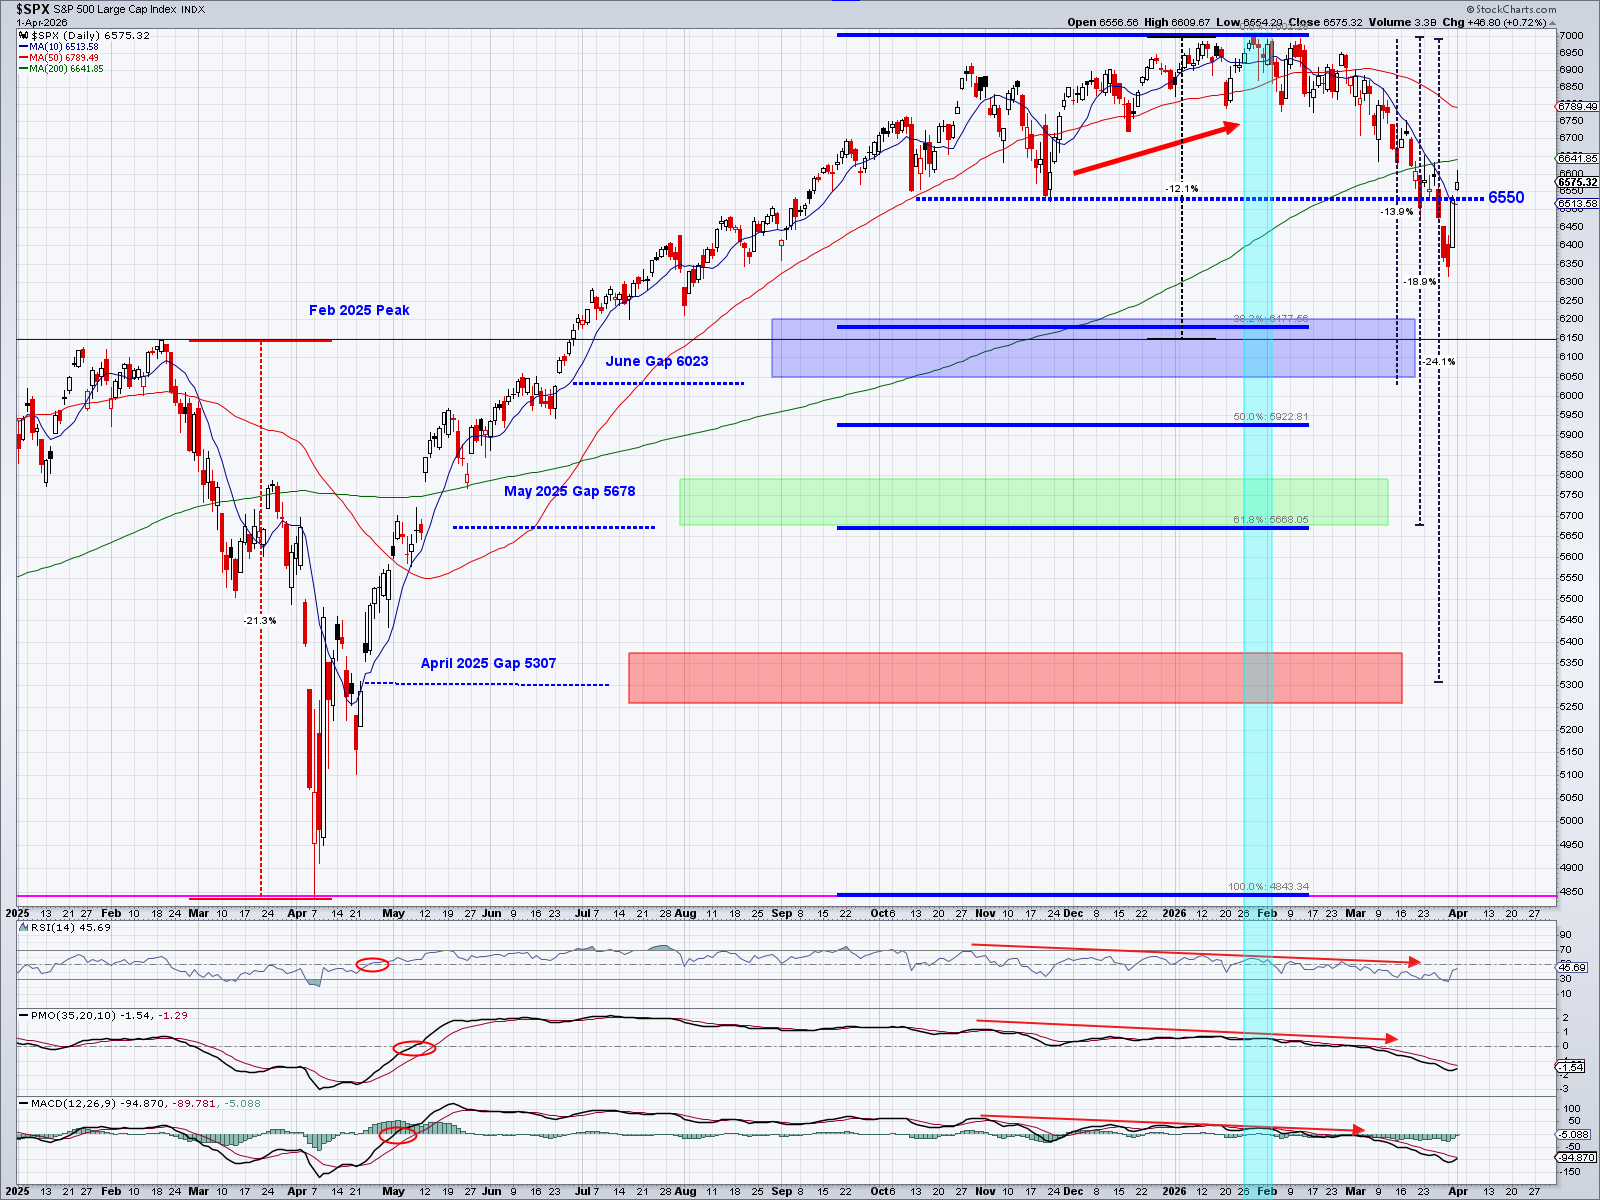
Below is an 15-month chart of the S&P 500 along with three technical indicators. Each of these is designed to measure the strength (or weakness) of price momentum—just in slightly different ways. And when all three start telling the same story, it’s usually worth paying attention.
In this case, all three began to roll over around October/November 2025 (as shown by the downward-sloping red arrows). What makes this particularly interesting is that it happened while the S&P 500 itself kept pushing higher.
That kind of mismatch—where price is rising but momentum is weakening—is known as a divergence. It doesn’t guarantee a drop right away, but it’s often one of the earlier warning signs that a pullback could be on the horizon.
Watching for Support
Once a correction gets underway, the focus shifts pretty quickly. Instead of asking how high the market can go, the question becomes: where might it find support?
Support levels are areas where buyers have stepped in before, and where they might do so again.
In this case, that level looked to be around 6550. It held briefly, but by Thursday of last week, the S&P 500 had closed below it—and then continued lower on Friday. That kind of break is something traders tend to take seriously, as it can signal that sellers are starting to gain the upper hand.
Looking for Clues on the Way Down
Of course, there’s no way to pinpoint the exact bottom of a correction. But there are certain patterns that can give us a framework.
One approach is to look at gap-ups—days when the market opens significantly higher than the previous close. These gaps often reflect strong buying interest, and they can sometimes act as support if the market pulls back to those levels later.
Since the last correction, which bottomed in April 2025, we’ve seen three notable gap-ups: April, May, and June of 2025. That said, it’s entirely possible the market doesn’t revisit—or “fill”—those gaps anytime soon, if at all.
Is This a Bounce… or Something More?
Over the last two days, the S&P 500 has jumped more than 4%, which on the surface looks encouraging. But without additional confirmation, this could be what’s commonly referred to as a “dead cat bounce”—a short-lived rally during a broader downtrend.
So far, the evidence seems to lean in that direction. For example:
Today, price rallied right up to the 200-day moving average (the red sloping line on the chart), only to reverse and close lower on the day. That type of reaction is fairly typical in downtrends—what used to act as support can quickly turn into resistance.
Key Levels to Watch
Looking ahead, the next area of support I’m watching sits between 6200 and 6150. What makes this zone interesting is that it brings together multiple factors:
- The first Fibonacci retracement level
- The February 2025 market peak
- A level within about 1% of the June 2025 gap-up
When multiple data points line up like that, the level tends to carry a bit more weight. A move down to that range would represent roughly a 12% correction, which—on a long-term basis—is actually pretty normal.
If the market doesn’t hold there, the next levels to keep an eye on would be around 5900, and then 5700. But for now, it’s best to take it one level at a time and see how price behaves as it gets there.
______________________________________________________________________________
This post is for informational purposes only. It is not intended as investment advice as each person’s financial situation is different. I strongly recommend working with a financial advisor who can deliver current information to you quickly and offer help with sorting through the various investing options.