Despite persistent naysayers in the media, economic indicators are signaling that the US economy is continuing to expand.
Positive Economic Indicators
Last week, the US Bureau of Economic Analysis (BEA) released the second estimate of Gross Domestic Product (GDP) for the second quarter of 2025. The second estimate of Q2 2025 GDP showed the economy grew at an annualized rate of 3.3%. This is an upward revision from the initial advance estimate of 3.0% reported in July.
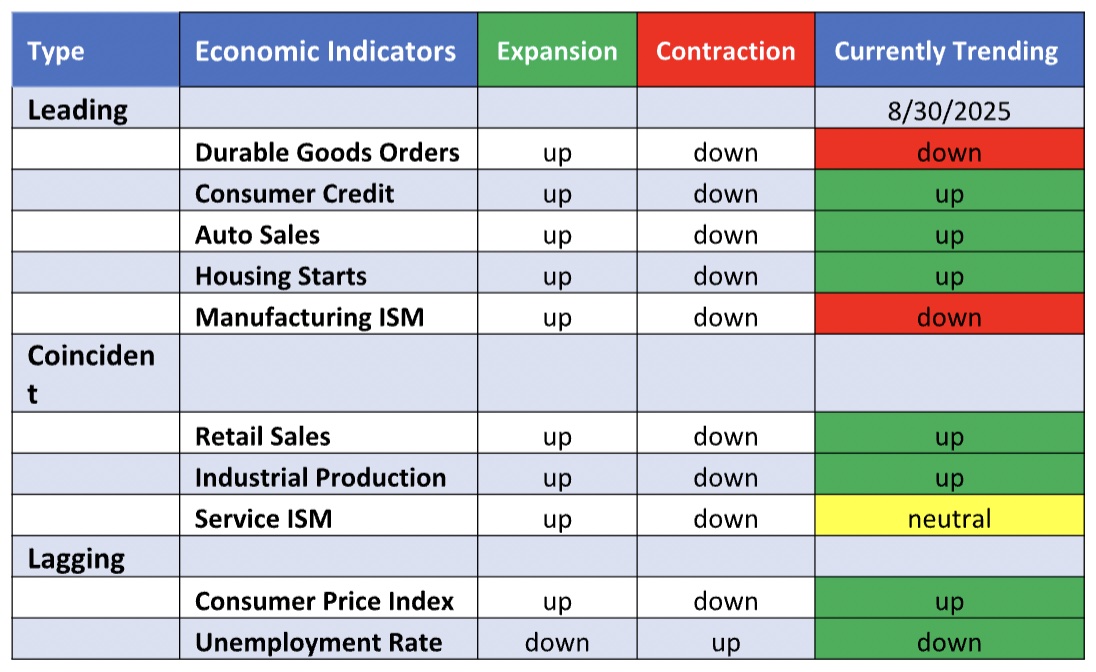
Sorry for all the economic nerdiness in this post, but if you can stay with me a little longer, below is a chart which shows the primary economic indicators that are used to help determine the direction of the economy and whether each indicator is a leading, coincident, or lagging indicator. The far-right column reflects the current direction of each of the indicators. Right now, seven of the ten data points are pointing in a positive direction for the US economy.
Interest Rate Cut Coming?
On August 22nd at the FOMC meeting in Jackson Hole, the Federal Reserve Chairman signaled openness to a 25 basis-point interest rate cut as soon as the upcoming September 16–17 FOMC meeting. As a result, the current CME Fed rate watch jumped to an 86% probability of .25 rate cute at the September meeting.
The Stock Market Knows
As I have previously mentioned in other posts, the stock market is a leading indicator, as well as those listed in the above chart. Traders and investors are particularly good at anticipating the market’s next move. The sector of the economy that outperforms during expansionary cycles and lower interest rate environments are small business owners.
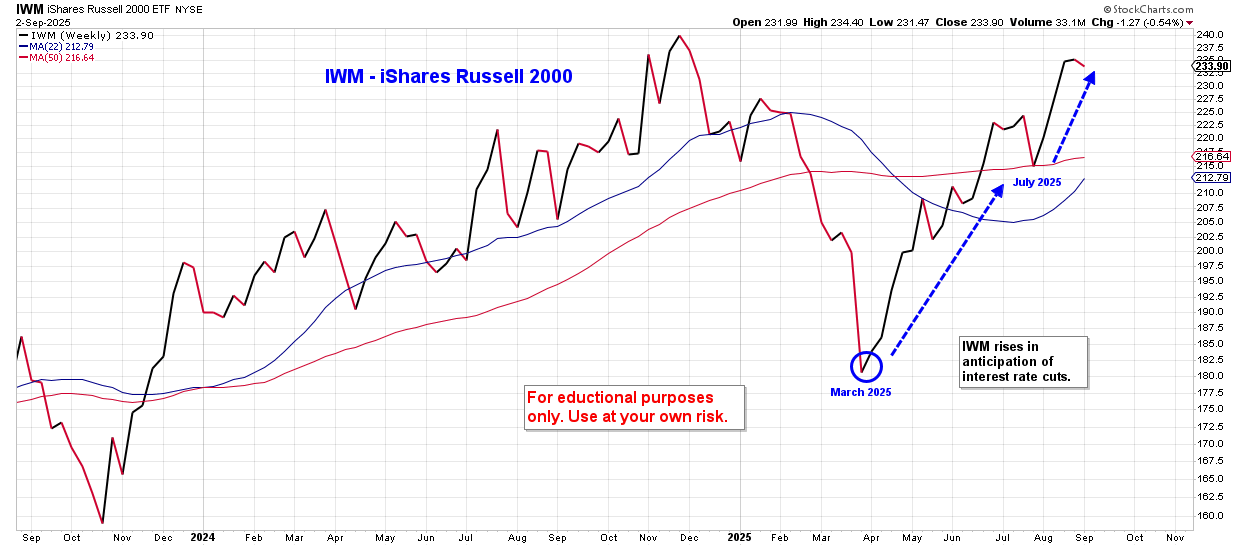
Below is the chart for IWM, which is a market favorite small cap ETF (iShares Russell 2000) that tracks smaller businesses in the US economy. Starting in late March of this year, the small cap stocks have been anticipating a cut in interest rates in the near future. While there was some hesitation in July that a cut would happen because initial jobs reports were not as bad as expected, once those reports were revised down significantly, the hopes of a rate cut rebounded.
More Good News
One other sign of confirmation of the possible upcoming economic expansion is found in the chart of the Dow Jones Industrials below. The DJI has broken out to all time highs despite all of the negative coverage regarding tariffs, interest rates, and jobs reports. Experience tells us that the setup seen in the chart below increases the probability of significant upward momentum for the next 6 to 12 months in the US economy.
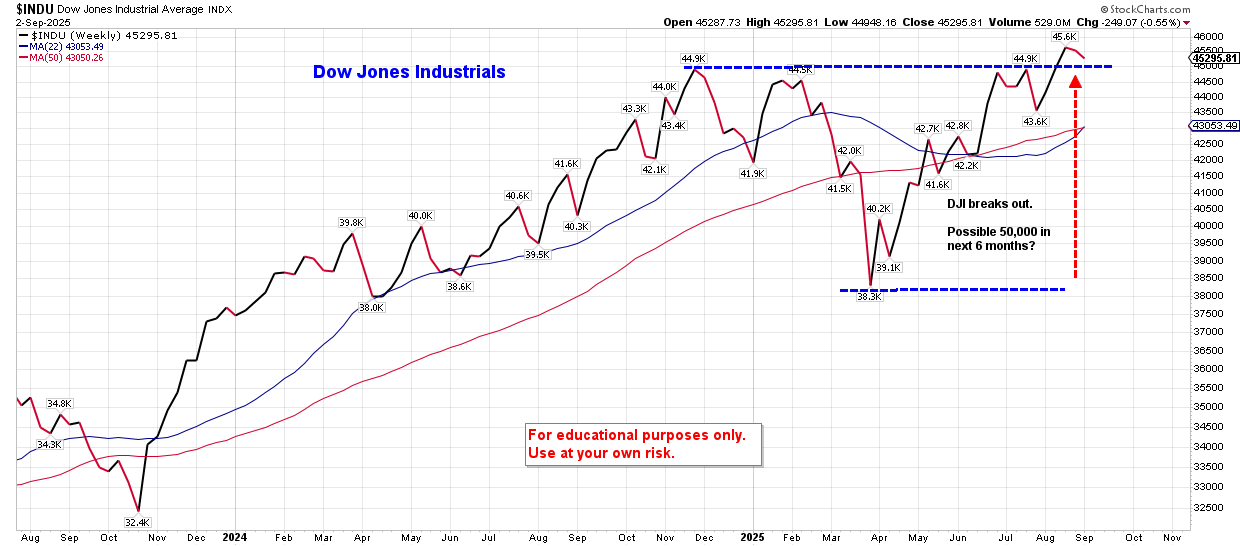
Could we see the DJIA reach 50,000 or more in the near future? Sure, but there are plenty of other variables that will most certainly make it a bumpy ride. Weather events, wars, and politics always play a short-term role in the direction of the markets. But currently, the trend is up, and that is holding steady for now.
______________________________________________________________________________
This post is for informational purposes only. It is not intended as investment advice as each person’s financial situation is different. I strongly recommend working with a financial advisor who can deliver current information to you quickly and offer help with sorting through the various investing options. Bret Wilson is a Financial Advisor with Wilson Investment Services, based in Rockwall, Texas.