Summer is almost over and as we head into fall, let’s take a look at how the major U.S. indexes are performing for the year and also in the 3rd quarter so far.
| YTD Return from 1/2/2018 | Qtrly Return from 7/1/2018 |
| S&P 500 5.65% | 4.06% |
| DJI 2.35% | 4.12% |
| Nasdaq 11.94% | 4.20% |
| NYSE 0.27% | 2.64% |
| Russell 2000 8.96% | 2.55% |
Thinking back to the January highs and subsequent 10% to 12% correction, the question came to mind “how are these indexes performing now six months later?”. As of this writing, here is where we stand:
- The Nasdaq has rebounded and hit 3 new highs this year. 4.3% above the January high.
- The Dow Jones Industrial Avg., while ahead for the year is still about 4% below its January peak.
- The NYSE just recently managed to move into positive territory for the year but is still 5.8% below the January high.
- The Russell 2000 (small caps index) went above its January high back in May and is 4.3% above that high currently.
- Finally, the S&P 500’s rebound leaves it less than 1% under its January high and up 5.65% for the year.
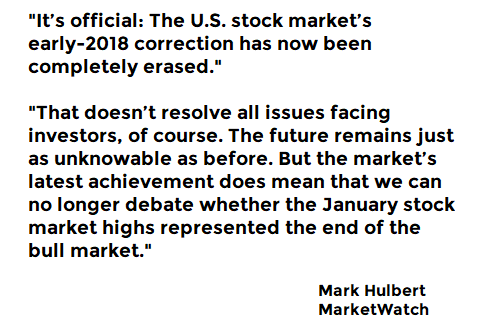
A quick review tells us that the tech heavy Nasdaq and small cap companies are having the best year so far. Of course, these would also be the asset classes that carry the most risk for investors. There are other very large US indexes like the Wilshire 5000 that have also managed to climb back over its January high. After the January/February correction, much of the financial world was writing and speaking about the end of the bull market and what caused it. Now, six months later, Mark Hulbert of MarketWatch.com summed it up like this:

His column is here: https://www.marketwatch.com/story/stocks-now-have-hit-new-highs-heres-why-that-matters-2018-08-06?mod=newsviewer_click
So as Mr. Hulbert suggests, if the bull market is not over, what can we expect? He is correct in stating that the future in unknowable, but there is evidence to suggest that a major change may be occurring
Back in January of 2017 I wrote about long term cyclical market trends and how there is evidence that the markets could be moving into a new, long term upward trend and coming out of a 13 (up to 23) year consolidation phase. Since then, more evidence has become available that gives more credence to that theory. In the next few days I will follow up this post with an explanation of that evidence.
Thanks for reading.

Recent Comments