
The S&P 500’s secular uptrend that began in April 2013 has produced strong overall gains, but quarterly seasonality has remained pronounced—with Q4 and Q2 standing out as the strongest performers on average.
In April 2013 the S&P 500 broke decisively above the prior highs of 2000 and 2007 marking the start of the current long-term secular bull market (see chart below). From that point through late 2026, the index has delivered robust cumulative returns, interrupted by cyclical bear markets, such as 2022, but characterized by resilient recoveries. Within this multi-year uptrend, quarterly patterns have continued to matter.
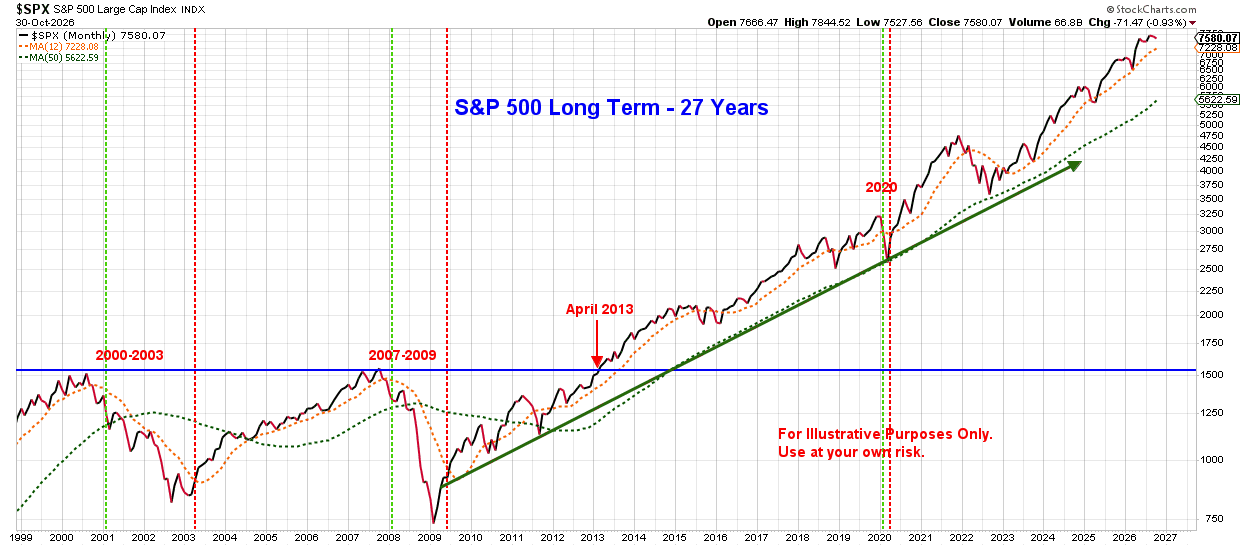
Key Seasonal Patterns Since the 2013
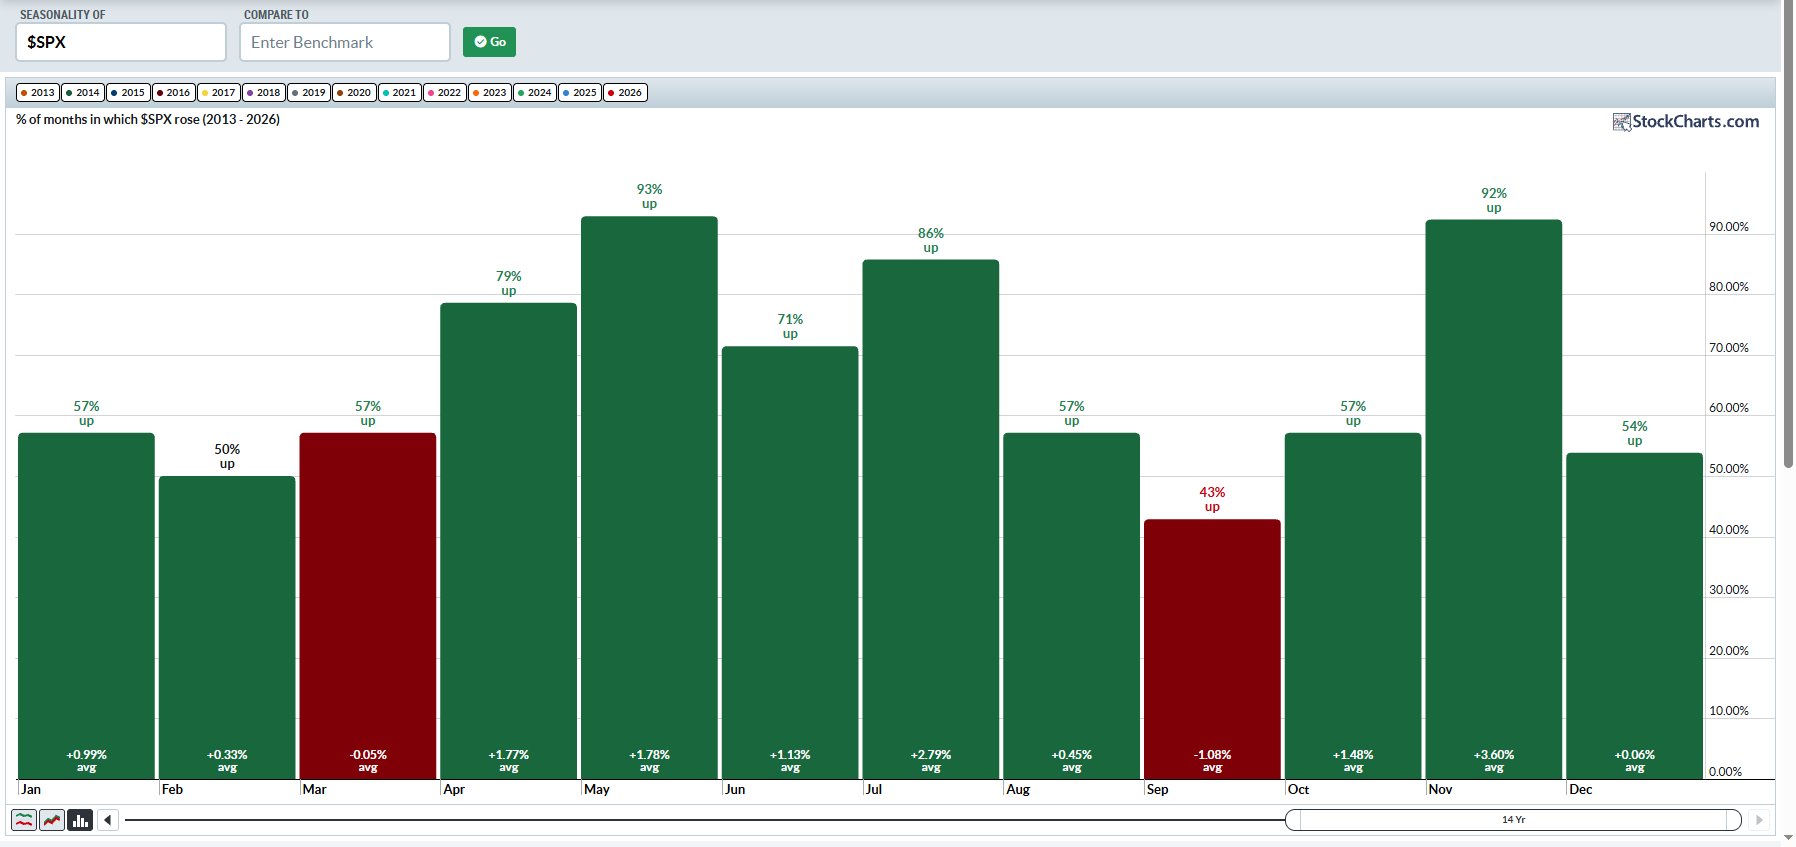
Looking at the S&P 500 for the 13-year period beginning in April 2013 through current day 2026, the chart below consistently highlights two quarters:
- Q4 has been the standout, with average returns frequently cited around +5.14%.
- Q2 has been a close second or strong contender, averaging roughly +4.68% in the post-2013 data examined in technical analyses of the secular trend.
Why These Patterns Persist Even in a Secular Bull Market in Q4 and Q2
Several forces contribute to the October-December (Q4) pattern:
- Year-end flows
- Tax considerations
- Institutional rebalancing
- Holiday optimism support October-December strength (the classic “Santa Claus rally” setup often begins earlier)
From April-June (Q2), positive patterns are influenced by the end of the first-quarter earnings season and seasonal optimism after winter.
Importantly, in a powerful secular uptrend the absolute returns in weaker months are often still positive or only mildly negative, and drawdowns have tended to be opportunities rather than permanent impairment. The first half of calendar quarters has also shown relative strength versus the second half in studies of the post-2013 period.
Practical Takeaways
Seasonality is a historical tendency, not a trading system. It is best used as context alongside trend, valuation, earnings, and risk management rather than as a standalone timing tool. During the current secular bull market:
- Historically strong months (especially November and April, followed by July) have offered favorable average odds.
- Weaker months such as September have been periods of higher average risk of negative returns, though the overall uptrend has limited lasting damage.
Conclusion
The April 2013 breakout launched one of the strongest secular advances in modern market history. Within it, the familiar calendar patterns—led by Q4 and Q2—have continued to shape the path of returns. As always, past performance is not a guarantee of future results, but understanding these tendencies provides useful perspective on where the odds have historically tilted.
______________________________________________________________________________
This post is for informational purposes only. It is not intended as investment advice as each person’s financial situation is different. I strongly recommend working with a financial advisor who can deliver current information to you quickly and offer help with sorting through the various investing options.
Bret Wilson is a Financial Advisor with Wilson Investment Services, LLC based in Rockwall, Texas.