Happy New Year
Hello, and Happy (somewhat belated) New Year! As we begin 2025, I wanted to give an update on where I think we are concerning market direction and market momentum with regard to the incoming administration and the changes in policy that will accompany it.
Trump Bump Disappears
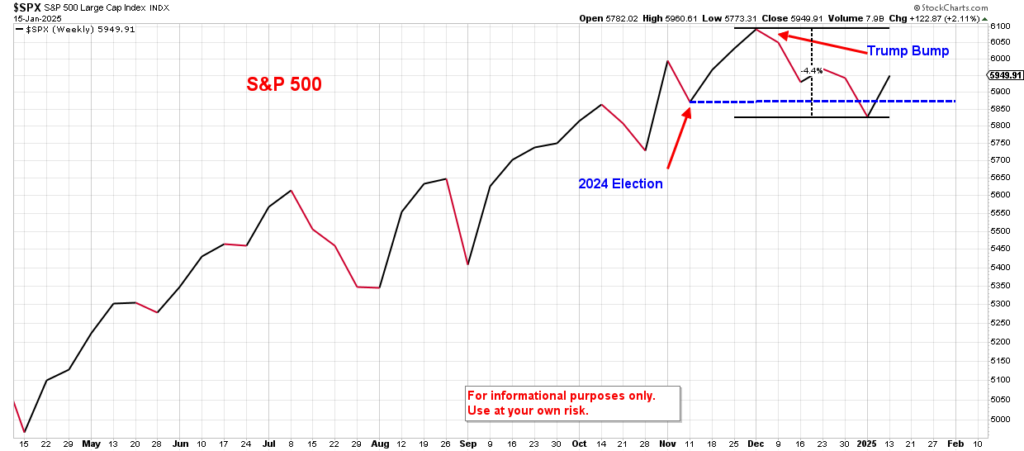
In my post-election commentary back on November 15th, I stated “The market took a significant jump the day after the election, but with the markets at all-time highs and in overbought conditions, I’m not sure we will hold those gains in the short-term.” Now, seven weeks later, the markets corrected and gave back all of the “Trump Bump” gains we experienced until today when improving inflation numbers were announced and markets reacted positively. See chart below.
In the same November 15th post I also mentioned that President Trump’s first year may be more difficult than most people are expecting due to the extreme government spending we’ve seen and the ramifications of that spending. Taxpayer dollars have been funding illegal immigrants and new government jobs to the tune of two trillion dollars, which has created a false economy. Once that short-term juice stops under a new administration, there is likely going to be some economic pain, and that could be reflected in the markets. Only time will tell if Trump’s immigration and energy policies will offset the previous administration’s spending.
Inverted Yield Curve
One other concerning issue involves interest rates—more specifically, an inverted yield curve. In a normal, relatively healthy economy, long-term interest rates on 10-year US Treasury bonds are higher than the rates on short term 2-year US Treasury bonds. An inverted yield curve is the opposite—short-term rates are higher than long-term rates. When this inverted yield curve occurs, it suggests that the market as a whole is becoming more pessimistic about the economic prospects for the near future.
While an inverted Treasury yield curve has proven in the past to be one of the most reliable leading indicators of a recession, it is not the cause of a recession. Since 1980, all six recessions have occurred anywhere from a month to several months after the yield curve has returned to normal. The US just experienced its longest inversion from December 2022 until September of 2024 when the yield curve returned to normal. The Federal Reserve rate cuts in the fall of 2024 were enough to lower the short-term rates below the long-term rates.
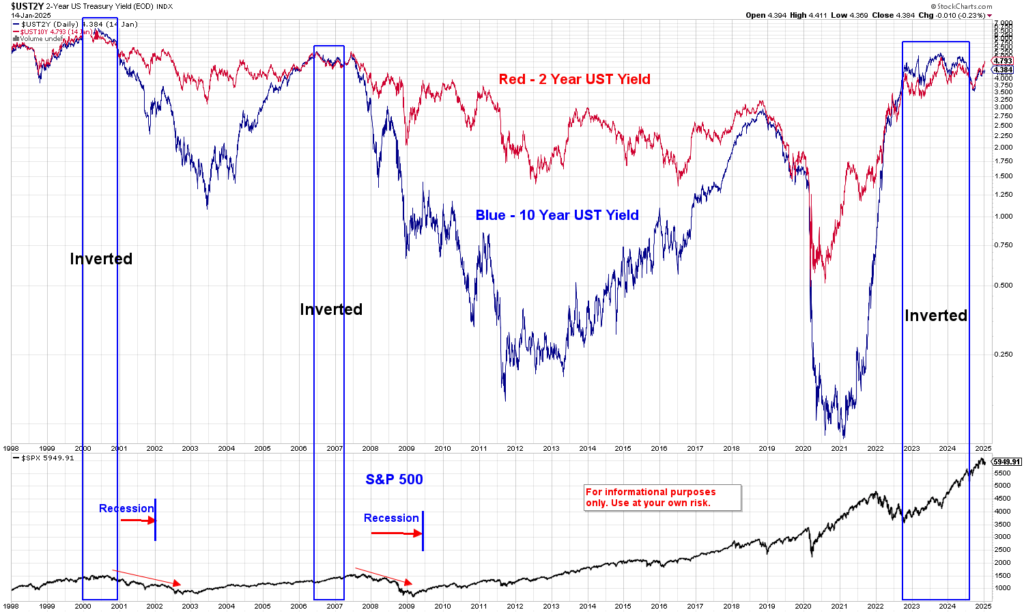
Below is a chart that combines the 2-year and 10-year US Treasury yields since 2000 with the S&P 500 below it. The blue rectangles indicate the three time frames this century that the yield curve was inverted, and the red arrows indicate the time frame for the following recessions. Please note that there technically was another recession in 2020, but, due to the pandemic being the cause (not issues with the economy), I did not include it. If the yield curve was inverted in 2020, the time frame would have been extremely short. The previous two recessions were tied to the bursting of the dot-com bubble (2001) and the financial/housing crisis (2008-2009).
Will the accuracy of the yield curve be any different this time? There have been false readings back in the 1960s of the inverted yield curve so we always have to consider that this time could be different as well. So far, the positive long-term trend is still intact, and I will continue to monitor the major index prices and their strength in 2025 and make adjustments as needed. As always, let’s keep an open mind, and continue to look for good opportunities.
_______________________________________________________________________________
This post is for informational purposes only. It is not intended as investment advice as each person’s financial situation is different. I strongly recommend working with a financial advisor who can deliver current information to you quickly and offer help with sorting through the various investing options. Bret Wilson is a Financial Advisor with Wilson Investment Services, based in Rockwall, Texas.


Recent Comments