When the stock market goes sideways, it is often called consolidation. This means that after stocks have been trending up or down, buyers and sellers agree and consolidate prices at current levels. The chart below of the S&P 500 for 2015 illustrates this. Since March of this year the S&P 500 has moved up and down within a range. This pattern is not unusual and can exist for anywhere from 3 to 6 months in indexes or individual stocks.
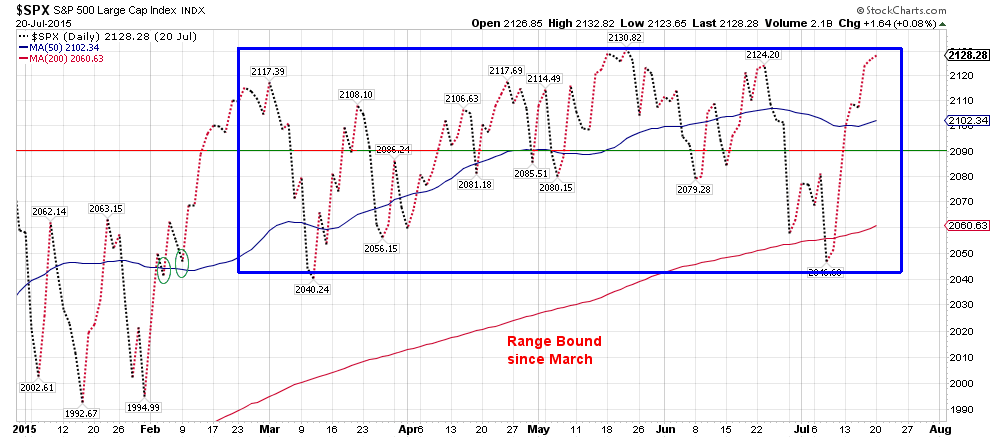
Click on chart to view.
Typically, when this pattern is broken it is usually in the direction the index was trending previously. The next chart of the NASDAQ from this year illustrates this. Note that from December of 2014 to February 2015 the NASDAQ consolidated and since then has continued the upward trend it had been in previously.
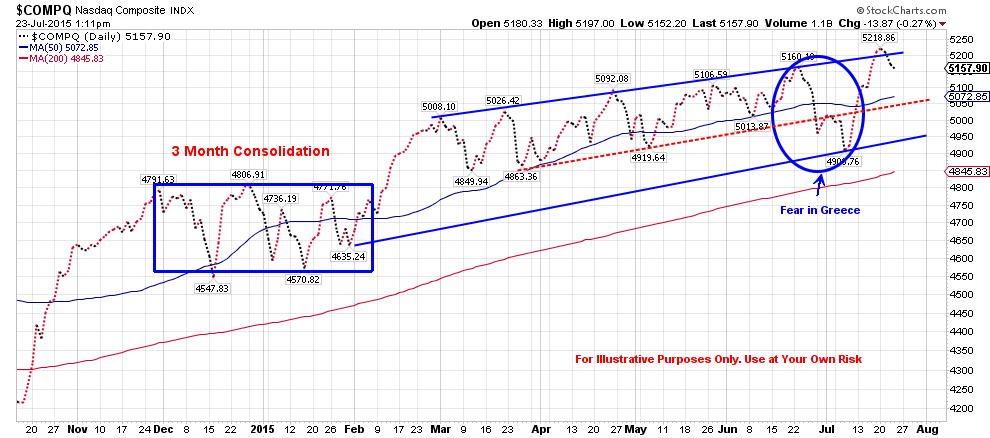
Click on chart to view.
There is no guarantee that an index or particular stock will continue the upward pattern after consolidating, but history tells us that there is a higher probability that the uptrend will continue. While a period of consolidation can be frustrating, its important that we remain patient with an open mind and a plan so that no matter which way the consolidation is resolved, we are ready.
Also, note in the chart of the NASDAQ the recent dip highlighted in the blue circle. This is the time frame I noted in my last post concerning the mess in Greece. Once Greece left the front page, the market bounced and actually set a new high for the NASDAQ.