History Doesn’t Repeat?
There’s an old saying that history does not repeat itself, but sometimes it rhymes. This means market movements up or down never looks exactly the same, but they can look similar. Therefore, I think it’s important to look for patterns that help create possible market scenarios in order to have a strategy in place for each scenario. The following scenarios are not predictions but simply my opinion of the most likely outcomes for the market.
Spotting the Pattern
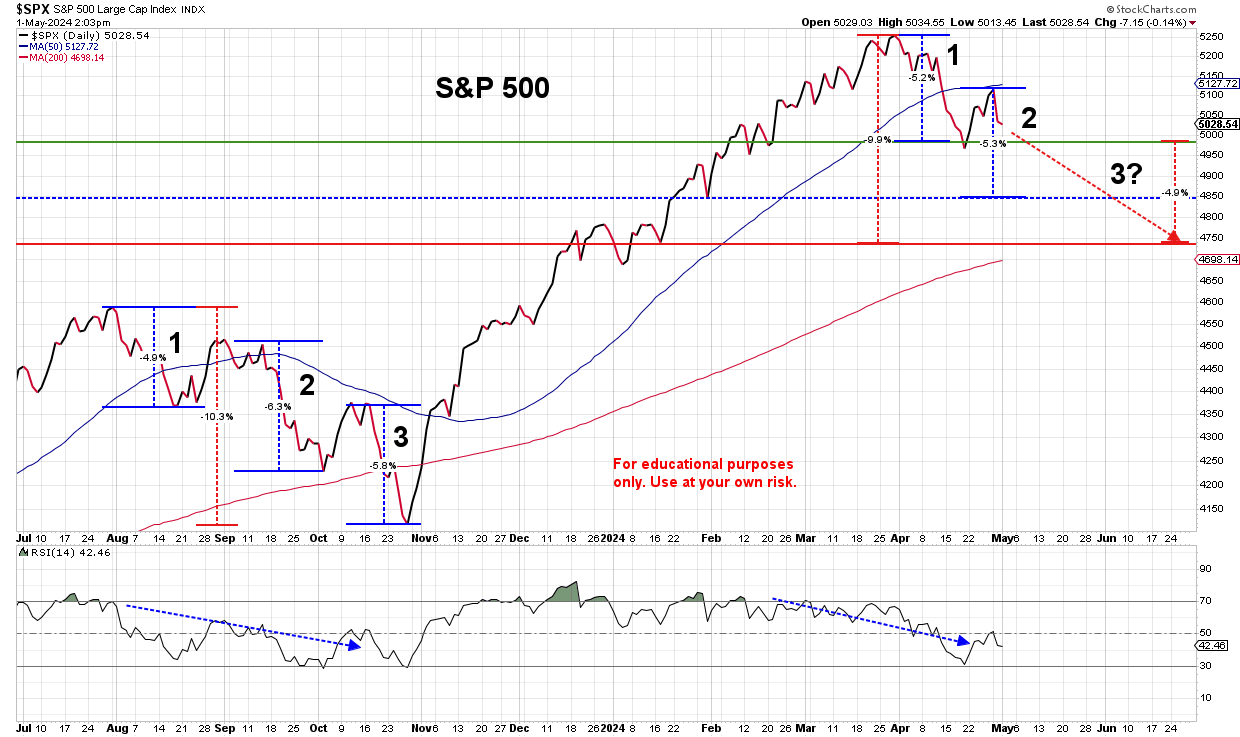
On the left side of the S&P 500 chart below, there is a 1-2-3 pattern that historically is a fairly common occurrence for the S&P 500. In August of 2023, the S&P began a 10% correction that ended three months later in late October 2023, but it took a stairstep approach on the way down. It would drop 5% to 6% and then rebound about halfway to the previous high before dropping 5% or 6% again. The bottoming process took place in late October and then the uptrend began and continued until April 2024 when the next correction began. I’ve added the Relative Strength Index (RSI) chart located right below the S&P chart. It is a momentum chart that is used to confirm the direction of the market. The downward sloping blue lines of the RSI from August 2023 to October 2023 look very similar to today and confirm the current direction.
On the right side of the chart, we can see how this same 1-2-3 pattern has begun to set up again. If it plays out similarly to the correction in 2023, there would be a bottoming out sometime in June that could line up with the next Fed meeting on June 12. This is one of three scenarios and has a greater probability of happening than the other two.
Here are the other two possibilities:
- May U.S. economic reports reveal that inflation is coming under control, which increases market confidence that the Fed will begin cutting rates and the market uptrend resumes. Prices would more than likely go sideways for a few weeks and bottom at the green line or possibly the blue dotted line before resuming the uptrend.
- May and June U.S. economic reports continue to disappoint the Fed, and they announce in June that either all rate cuts are off the table for 2024, or the possibility of a rate hike is introduced. At that point markets could fall and test the August 2023 highs between 4550-4600 or go lower and test the October 2023 low between 4150-4100.
Fed Meeting This Week
The FOMC meeting ended today and the committee left interest rates unchanged and plans to hold rates steady, noting that inflation has stalled out at 3.5% despite their effort to reach the 2% target. In his remarks this afternoon, Fed Chair Jay Powell calmed Wall Street by making it clear that “it is unlikely the next policy move will be a hike.” But he would not say if the three rate cuts in 2024, as was hinted at in March, are still on the table.
Keep in mind, that the longer rates stay up, the less likely it is that the market can continue its uptrend in either the short-term, intermediate-term, or long-term. Constantly evaluating markets and the factors that affect them is important in order to continuously create scenarios and updating strategy in regards to those scenarios.
_______________________________________________________________________________________
This post is for informational purposes only. It is not intended as investment advice as each person’s financial situation is different. I strongly recommend working with a financial advisor who can deliver current information to you quickly and offer help with sorting through the various investing options. Bret Wilson is a Financial Advisor with Wilson Investment Services, based in Rockwall, Texas.