Trend Following
Patience is the key to long term investing. You may have heard the axiom, “don’t fight the trend.” Normally I would agree with this, but historically during the 1st quarter each year, January is the best month and March is the worst. So, if March is the worst month, how bad could it be?
We continue to be in a secular long-term uptrend, so I don’t expect March to give us a big correction (down 20% or more) considering we just had a healthy correction that ended at the end of October. But it’s possible there will be a 5% to 10% pullback in the market indexes in March; that kind of short-term pullback will give us a buying opportunity.
Sector Performance
Below is a list of 11 Sector ETFs and their performance rank over the last three months. Notice that the bottom half of the chart contains mostly defensive ETFs like XLU, XLE, and XLP. Over the last three months, money has been moving out of those three ETFs and into growth sectors like XLC, XLK, and XLI which tells us that the markets have been bullish over the last three months. A six-month rankings’ list looks very similar. This means that, despite what you may hear and read in the media, the markets are very positive about the future.
| SYMBOL | NAME | LAST | CHG | % CHG | +/- | |||||||
| XLC | Communication Services Sector Fund | 79.36 | 10.12 | 14.51 | ||||||||
| XLK | Technology Sector Fund | 206.98 | 23.83 | 12.87 | ||||||||
| XLI | Industrial Sector Fund | 121.00 | 13.09 | 12.10 | ||||||||
| XLF | Financial Sector Fund | 40.34 | 4.26 | 11.83 | ||||||||
| XLV | Health Care Sector Fund | 144.82 | 14.74 | 11.23 | ||||||||
| XLY | Consumer Discretionary Sector Fund | 184.41 | 13.81 | 8.08 | ||||||||
| XLB | Materials Sector Fund | 87.56 | 5.31 | 6.41 | ||||||||
| XLP | Consumer Staples Sector Fund | 74.45 | 3.96 | 5.62 | ||||||||
| XLRE | Real Estate Sector Fund | 39.11 | 1.60 | 4.25 | ||||||||
| XLE | Energy Sector Fund | 86.14 | 3.21 | 3.81 | ||||||||
| XLU | Utilities Sector Fund | 62.10 | -1.54 | -2.44 | ||||||||
What’s the Trigger?
Patience is the key for the next part of the setup. I am looking for the event that could trigger a 5% to 10% correction that sets up a buying opportunity. Potential triggers could be economic reports like employment and unemployment reports (due out next week) or the FOMC meetings, which take place March 19-20. Any news that could delay interest rate cuts until later in the year could create a pullback.
Long-Term Trend
Just in case you’re wondering if the markets are still in a long-term uptrend, see the 25-year monthly S&P 500 chart below.
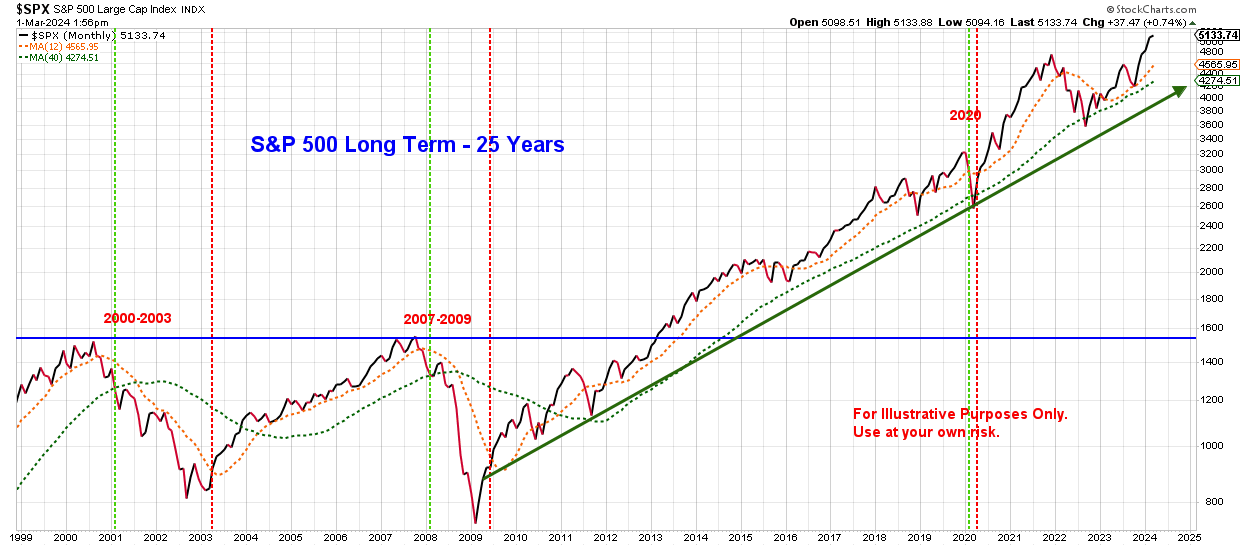
The S&P 500 broke through a ceiling in 2013 and has been climbing ever since. There have been some hefty corrections along the way, but the trend is still up. But there have been plenty of buying opportunities along the way which is what we are looking for in March.
__________________________________________________________________________________________
This post is for informational purposes only. It is not intended as investment advice as each person’s financial situation is different. I strongly recommend working with a financial advisor who can deliver current information to you quickly and offer help with sorting through the various investing options. Bret Wilson is a Financial Advisor with Wilson Investment Services, based in Rockwall, Texas.