Markets have rebounded from their recent lows and appear to be resuming their uptrend. Below is a weekly chart of the S&P 500 (click on image).
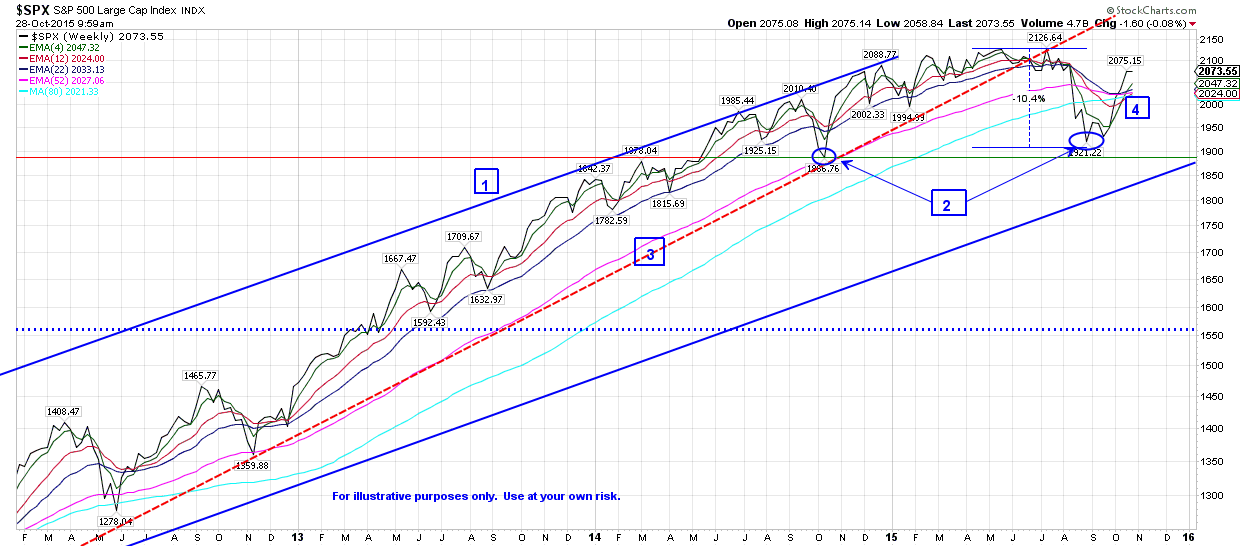
1. Area between the two blue lines shows the long term trend of the market since mid 2009. So far we have stayed within those trend lines.
2. Higher low in September as compared to the October low of 2014 is positive.
3. Red dashed line shows intermediate trend line which we crossed under and deserves watching.
4. Price has gone back above trend lines and the 22wk moving average is above the 52wk moving average which are both positive signs.
So based on this chart the questions I am asking are:
Will price go back below moving averages and close the week there and will 22wk ma go below 52wk ma and also close the week in that position?
Will we make a higher high in the coming months or a lower low?
Right now I think the probabilities favor the uptrend for several reasons including those just mentioned.
Below is a chart that measures how much cash is flowing into a Rydex Bear fund as a percentage of total cash flows (pos or neg) into the fund. Or rather, how much money is shorting the market on any given week? The S&P 500 is in the upper panel and the Rydex short ratio is in the lower panel (Click on image).
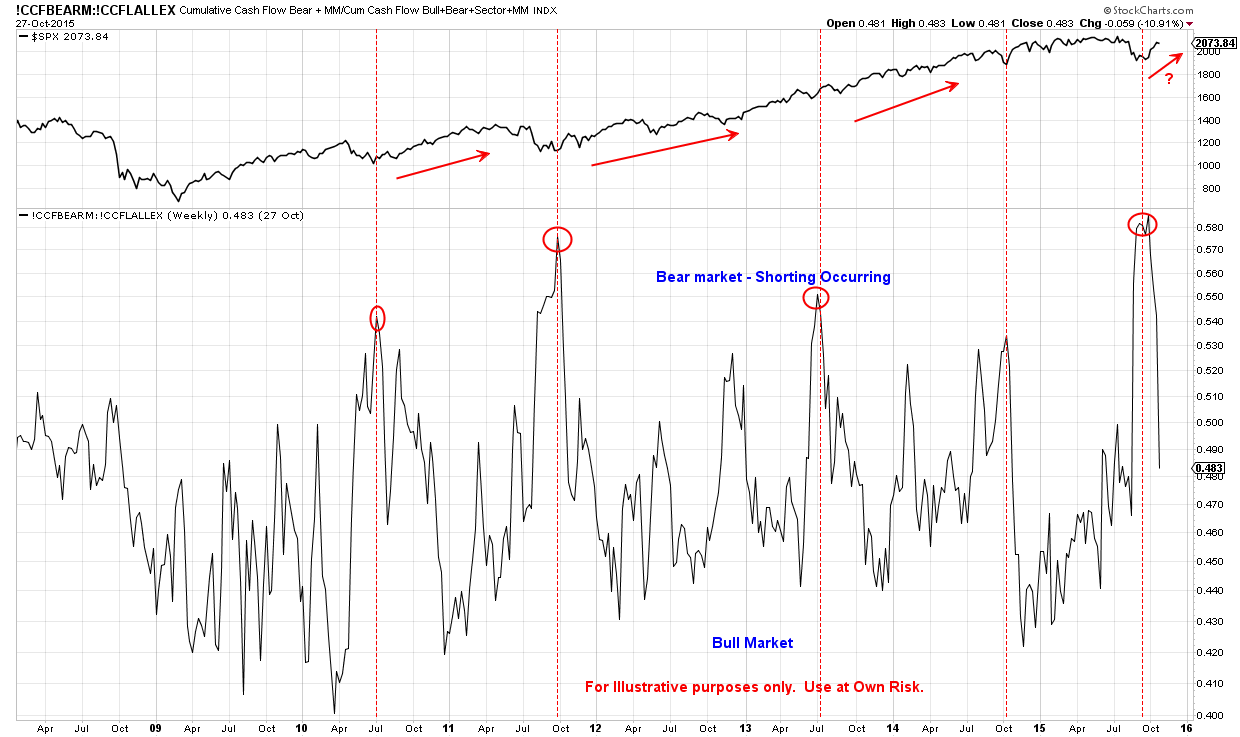
First, each peak in the lower panel shows the high level of shorting occurring in the market. Once that peak turns over, the market begins resuming its previous uptrend indicated in the upper panel. The recent peak in market shorting and the current short covering that is occurring indicates investor behavior that is a little panicked and afraid of missing an uptrend.
Second, central bankers around the world are attempting to stimulate their own markets. The Peoples Bank of China cut their rate last week and the head of the European Central Bank hinted at more QE coming in December (via The Guardian).
Lastly, if you refer back to the first chart, you can see that the last quarter of each year tends to be positive for the markets. The old adage “Sell in May and go away” ends its annual 6 month run, and while data doesn’t always support that idea, human behavior usually does not disappoint.
In conclusion, the combining of price momentum, central banks stimulating, a crowded short sentiment reading, and a historically positive last quarter leads to a higher probability of a continued uptrend.
Email me with any questions at bret@wilsoninvestmentservices.com.