Market Summary 1-14-2016
Attempting to forecast markets is usually a big mistake. Looking back, the track record for those giving their economic and market forecasts is not very good. Occasionally someone gets it right, but the misses far outweigh the hits. So the best approach is still to look at the facts on hand.
One way to keep an eye on the market’s interpretation of direction is to look at market trends. When trends are bullish, it tells us markets are positive relative to future expectations. When trends are bearish, it tells us the markets have concerns about future outcomes. Currently the trends lean towards bearish. But before we look at those trends, I want to present some keys to handling bearish markets from Cullen Roche’s blog. Mr. Roche is described as a technical economist, and he has a lot of expertise in monetary theory and behavioral finance. I read his blog regularly, primarily for his common sense. The following is from his blog at www.pragcap.com on 1-12-2016.
1. Don’t lose your perspective. Resisting recency bias is the greatest struggle for most investors. And unfortunately, most people never overcome it. The financial markets are a revolving door of investor after investor dying one funeral at a time thanks to excessive short-termism.
2. Turn off the news. Most of the financial media isn’t there to help you. They’re there to get your attention so they can earn a profit selling ad placements. Unfortunately, there is no emotion more powerful than fear. This is why financial TV ratings surge during bear markets. You tune in, get scared out of your wits, churn up a bunch of taxes and fees in your account, sell into panics, rinse wash repeat. I turned off financial TV almost a decade ago. It was one of the best financial decisions I ever made.
3. Stop looking at your account. Fidelity once found that investors who don’t log-in to their accounts perform better than investors who log-in regularly. The best thing most investors could do is lose their password to their account about once every five years. Logging in and incessantly focusing on your portfolio is just about the best way to ensure that you become a victim of recency bias.
4. Focus on something else. Get your mind off the short-term swings in the market. There is nothing you can do to control the markets. Excessive activity is the illusion of control during the course of creating inefficient portfolio frictions. Get your mind off your portfolio by focusing on hobbies or work. Sitting around worrying about your portfolio isn’t going to help you or your portfolio.
Recency bias is overreacting to the last thing that happened in the market. I hope that help you keep some perspective about our current environment.
There is a lot of data I could overload you with, but I won’t. Instead, I will show you one piece of data I’ve been watching closely.
Below is a weekly chart that compares the US 30-year Treasury Bond to the S&P 500 over 20 years. It is labeled Chart 1. The S&P 500 is shown in Chart 2 over the same time frame. Typically in bull markets the S&P 500 will outperform the 30-year Treasury bond and in bear markets the reverse is true.
For example, in Chart 2 from 1996 to late 2000 the S&P 500 was in the last four years of a bull market. Chart 1 is in a downward trend during the same time period because the S&P 500 was outperforming 30- year Treasury Bonds. You can see this pattern played out again from 2003 to late 2007 and again from early 2009 to today.
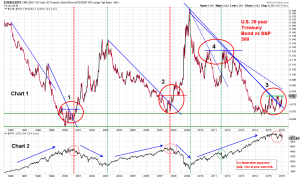
I have labeled three places in Chart 1 where this pattern begins to change. At points 1 and 2, the blue downward-sloping trend line is broken, as the ratio starts to turn and begin moving upwards. At the time, there was no certainty that the ratio would continue to move upward, but it did provide a signal to be cautious and to take steps to be more defensive. Point 4 (in 2011) shows the ratio breaking up through the dotted blue line midway through 2011, but before the end of the year the ratio began coming down again, and defensive tactics were no longer necessary. Of course there was a lot of other information to consider at the time, and that information also indicated a higher probability that the bull market would continue.
Point 3 is where we are today. The blue trend line has been broken, and the ratio is now hitting resistance at the green line. I began writing this yesterday (January 13th) when the market was really struggling, and as I worked to finish writing this today (January 14th), the market has had somewhat of a recovery.
At this point, its a good idea to keep an open mind and keep weighing all the evidence. But taking a more defensive approach at this time would certainly not be unwarranted.