Good morning.
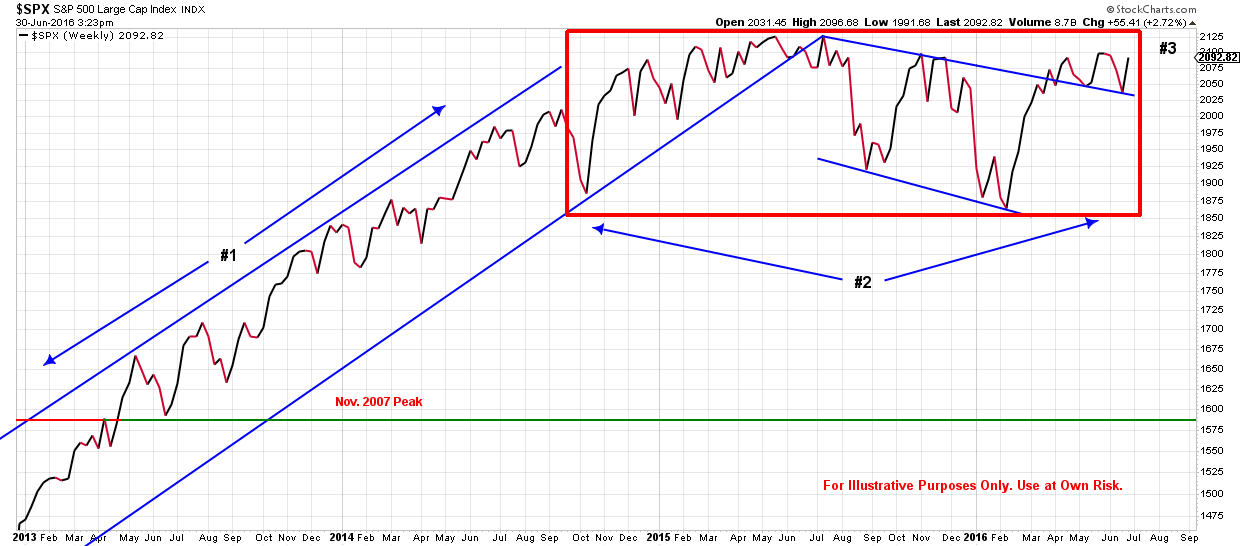
My last post included this chart, and I stated “In order for the S&P 500 to make progress and break through the current sideways trading range, it needs to move upward through the 2100 – 2130 levels (#3). So far this year, it has approached those levels twice, but has been unable to climb through. “
Below is that same chart today, almost 4 weeks later. Note the red circle in the upper right corner of the chart as compared to the previous chart.
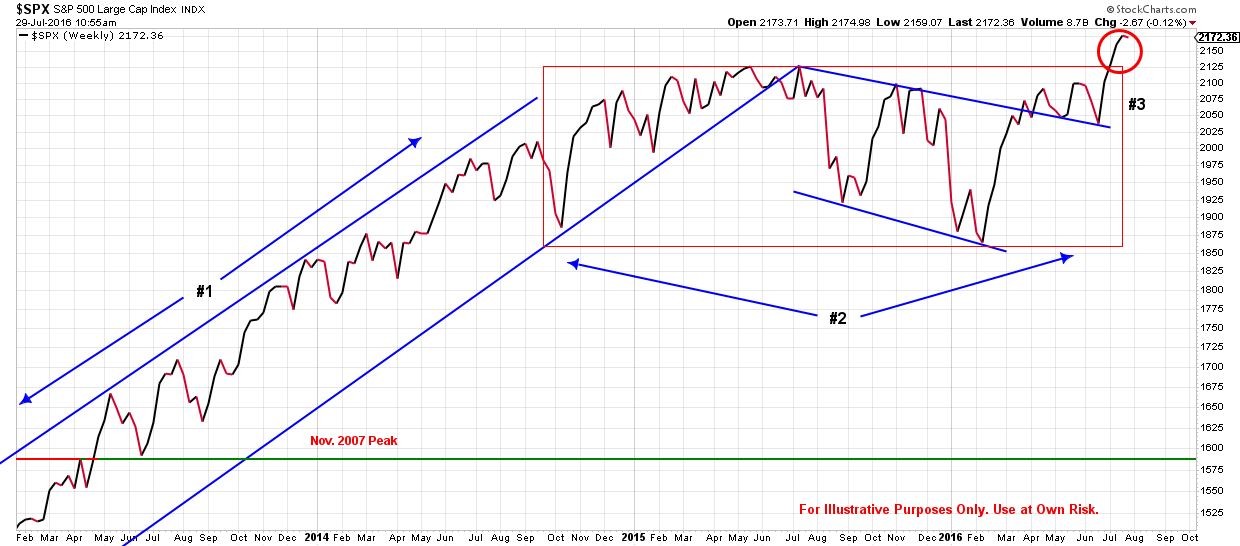
After being in a sideways trading range for almost two years, the S&P 500 has broken out of the trading range and moved higher. So the question is, can it maintain this momentum. continue to move higher, and, if so, for how long?
The answer to those questions will depend heavily on what the Federal Reserve decides to do with regard to interest rates. Last December, the Fed raised interest rates .25% and declared that they could possibly raise rates four times in 2016. As a result the S&P 500 began 2016 with one of its worse starts ever, dropping 10%, sending a message to the Fed that investors did not think the economy was strong enough to begin absorbing rate hikes. In response, by the end of January, the Fed began to signal that they would back off their rate raising stance. Then again in June, they reaffirmed that direction saying that keeping rates low could offer a better long-term strategy. They also added that they could begin injecting money into the market again (see headline below). As a result, the S&P 500 reached a new all-time high.
MarketWatch: Yellen says helicopter money belongs in Fed toolkit Published: June 15, 2016 4:43 p.m. ET
Source: MarketWatch Link – http://www.marketwatch.com/story/yellen-says-helicopter-money-belongs-in-fed-toolkit-2016-06-15
So it does look like the markets will continue to try and move higher with some assistance, but answering the question of “how long” is more difficult to answer. To assist in looking for those answers, it’s important to have systems in place that look for trends.
Therefore, it is very helpful to use technical models and monitor money flows into and out of different asset classes and sectors in combination with pre-defined rules on when, where, and how much to buy and sell based on individual risk tolerances. All of which I continue to do.
If you have any questions please let me know.
Bret