I think I have touched on secular bull or bear markets before, but I wanted to put a little more focus on it in this post. Most people are familiar with the term bull or bear market but do not know that those markets can be defined in different time frames. Secular markets, whether bull or bear, cover a much longer time frame than cyclical markets and I want to give a visual of what a secular bull/bear market looks like and where we are today.
Primarily when the media is discussing bull/bear markets they are referencing cyclical markets which are tied to the business cycle. Secular bull/bear markets, on the other hand, can last up to a generation as evidenced by the last secular bull market which ran from 1982 to 2000. While there were numerous business cycles during that time frame and cyclical bull/bear markets occurred, the primary direction of the stock market was up.
The last secular bear market was from 2000 to 2013 as pictured below. This market is defined by its peak in 2000 and a similar peak in late 2007 at which both times the S&P 500 experienced major corrections.
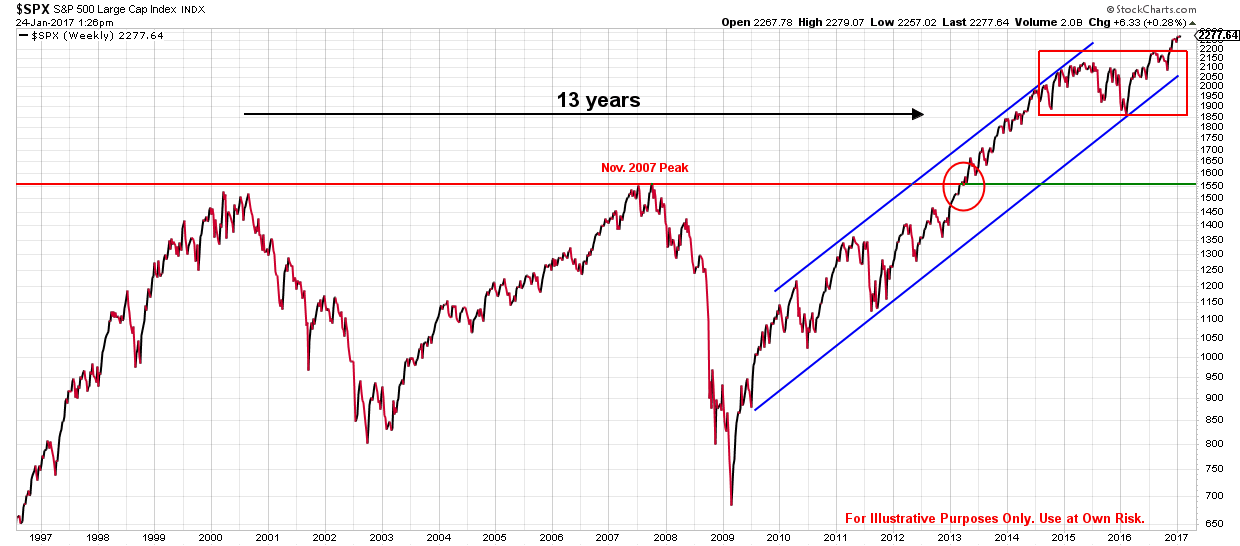
However, in early 2013 the market approached the same peak but broke through this time. This marked what I believe was a secular change in the markets. This means that even though the breakout was 3 years ago we are still early in this one as far as historical secular markets go. Note that a change in secular market is measured from the breakout (2013) not the bottom (2009).
Markets can do anything at any time and today is no different. That being said, I think the probabilities of this trend change being correct are very good. Please note the red box in the upper right corner of the chart shows that even in a secular bull market, there can be corrections and the market can move sideways for several months.
The last note of interest is that right before the last two major correction in 2000 and 2008 there was excessive, irrational, exuberance by investors which is typically a good sign a upward trend is about to end. A Gallup Poll from April 2016 which showed what percentage of adults in the U.S. were currently invested in the stock market indicated that the percentage was a 19 year low of 52%.
WASHINGTON, D.C. — “With the Dow Jones industrial average near its record high, slightly more than half of Americans (52%) say they currently have money in the stock market, matching the lowest ownership rate in Gallup’s 19-year trend.”
Those who are waiting for a good time to get reinvested are probably still letting their experience of the last decade and the fear that creates dominate their thinking. Being cautious and prudent is never a bad thing, but it cannot override all decision making criteria.