Market Commentary September 22, 2017
Fall has arrived, and it looks like there is finally some movement in the market. During the summer months, the S&P 500 has been moving sideways—not unusual for that time frame. But as fall begins, investors and traders are back from their summer vacations, and the volume of shares traded has begun to increase. Also increasing has been the value of the major indices which have reached all-time highs. Interestingly enough, this has happened despite North Korea testing missiles, two major hurricanes hitting the U.S., a terrorist bombing in London, and our two political parties floundering in confusion. The uptick in the markets, in spite of the negative news, indicates there is some strength behind this move.
Two headlines from last week give some clues as to where that strength is coming from. The Washington Post on Sept. 12 reported:
U.S. middle-class incomes reached highest-ever level in 2016, Census Bureau says
And USA Today reported on September 14, 2017 that job openings are at a 17 year high:
U.S. job openings are at a record high. Here’s how to snag one
So despite all the geo-political bad news, the good news in the economy seems to be giving confidence to business and investors. Also shoring up confidence is the fact that all the major indices have not only reached all-time highs but have broken out of a 13-16 year sideways move to the upside and have been able to hang on to those gains when tested. In the last three years, the Dow Jones Index, the S&P 500, the NYSE, and the Russell 2000 have all broken out of their consolidation phase.
The last index to finally do so was the tech-heavy NASDAQ. Below is a 20-year monthly chart of the NASDAQ that reflects that accomplishment in the spring of 2016. Many will remember the hysteria of the dotcom bubble from the late 1990’s and how high the NASDAQ soared during that time followed by the 75% crash that finally ended in late 2002. It has taken 16 years for this index to regain that high, surpass it and hold on to it.
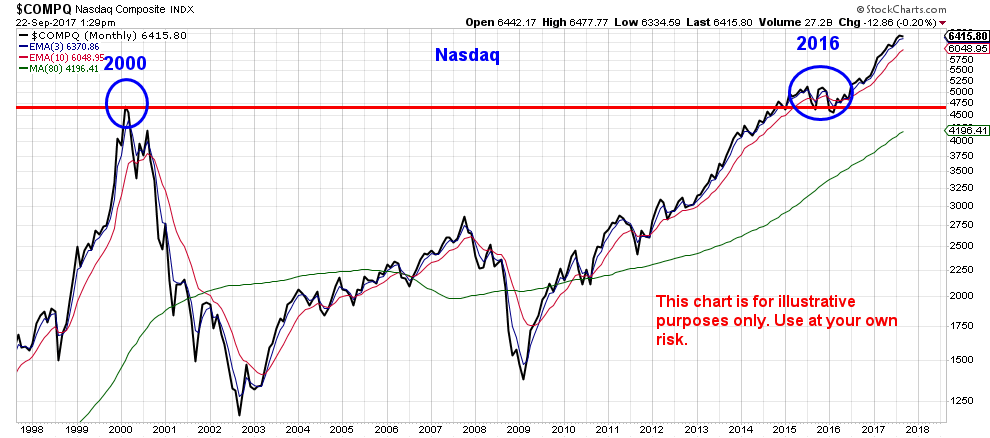
The reason for displaying this chart and the history lesson behind it is a reminder that, since the Great Depression, markets cycles have had a history of 15-20 year booms and 10-15 years of downturns or consolidation. Looking back, the current up-cycle seems to have started between 2013 and 2016, and as current economic data seems to indicate, the probability is high that it can continue into the foreseeable future. Also this is a good reminder to not let current events in the news cloud your judgment and cause you to make snap decisions
Of course no one can guarantee how long these positive conditions will continue, and the markets will still have dips even if they are trending up. So keeping emotions in check and maintaining focus and discipline will continue to be the primary objective.
Bret A Wilson
President, Wilson Investment Services, LLC