Consolidation or Higher Highs, Higher Lows?
As I’ve mentioned before, there are times when the stock market goes through periods of consolidation, meaning that it moves sideways for a period of time. In the chart below this is illustrated in the time frame of 2015-2016. There’s no telling how long these phases will last and no two are exactly the same. On the right side of the chart during the 2018 time frame, an argument can be made that the S&P 500 is in another consolidation phase.
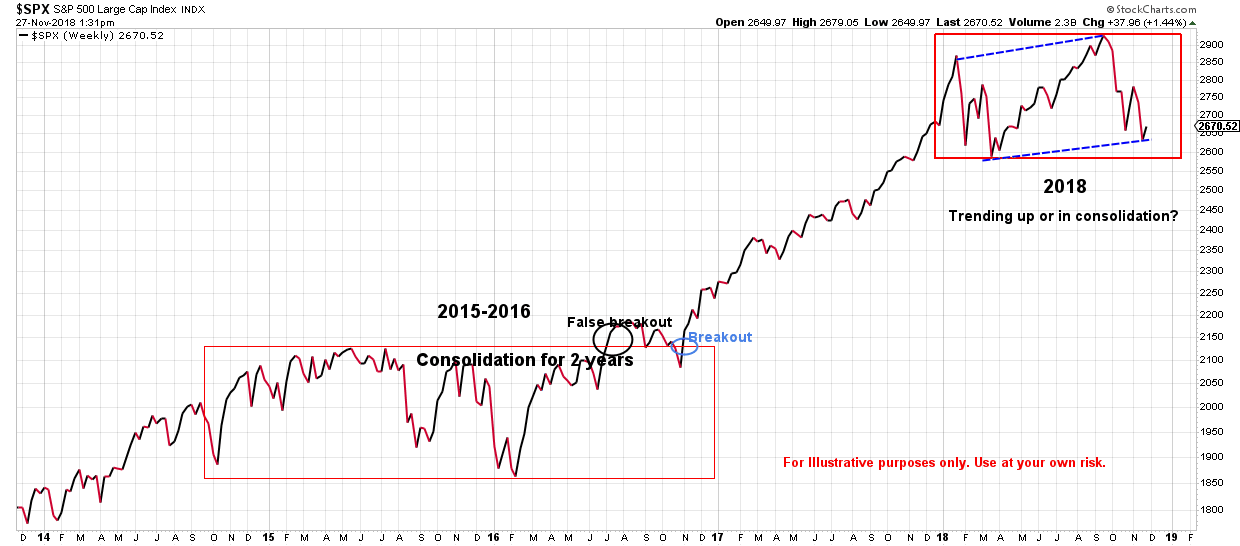
The case can also be made that the S&P 500 is still trending up albeit at a slower pace than 2017. The phrase “higher highs, and higher lows” is used to describe a market that may be experiencing volatility, but it is trending in an upward direction. This is illustrated on the right side of the chart during the 2018 time frame. In January of this year the S&P 500 hit a new all time high and then proceeded to fall back by about 10%. It then began the climb back to another all time high in September followed by about a 9 1/2% retracement.
Regardless of which scenario you choose, both can be a little frustrating in the short term. But in the bigger picture you can look at the chart above and see the long term growth trend in the S&P 500 over the last 5 years which is a good reminder to stay patient when others panic.