As I have written many times before, it is impossible to time the market, but as Winston Churchill once said, “History repeats itself.” Historically measuring the breadth of the market is one of the indicators that can give us a clue as to how close we are to a market bottom. Breadth of the market simply means how much participation there is from buyer and sellers in the markets.
Watch The Nasdaq
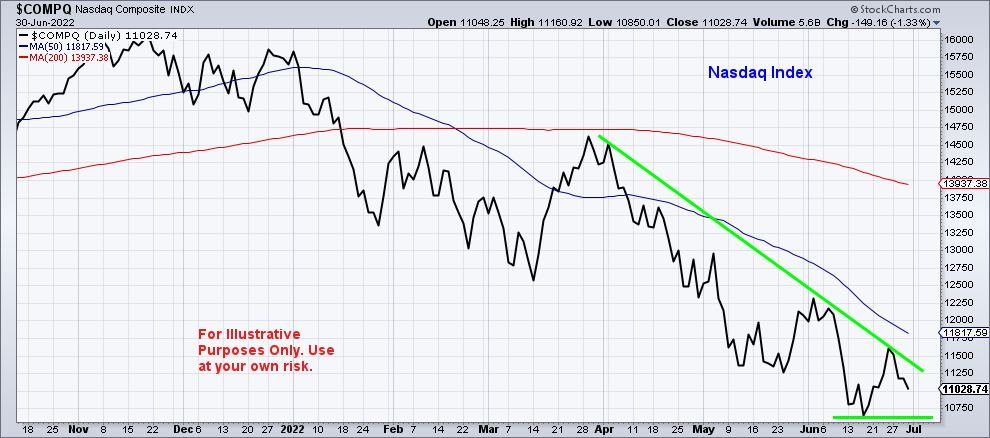
Because of the higher risk stocks found in the Nasdaq Index, it tends to lead the other indexes during down trends making it useful for measuring breadth. The first chart below is a daily chart of the Nasdaq with 50- and 200-day moving averages in red and blue. The price is below both the 50- and 200-day moving average with the 50-day below the 200-day. Price has not been above the 50-day since mid-April, so a break above the blue line would be a good indicator of a market bottom. Also, we would like to see the price stay above the bottom green line and start seeing higher lows.
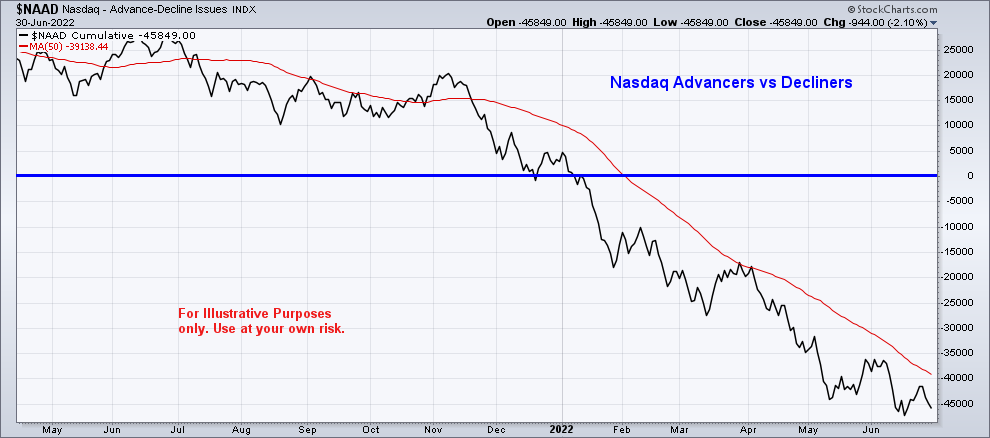
This next chart shows the volume of stocks that are advancing versus declining. This indicator is negative and has been below zero since January.
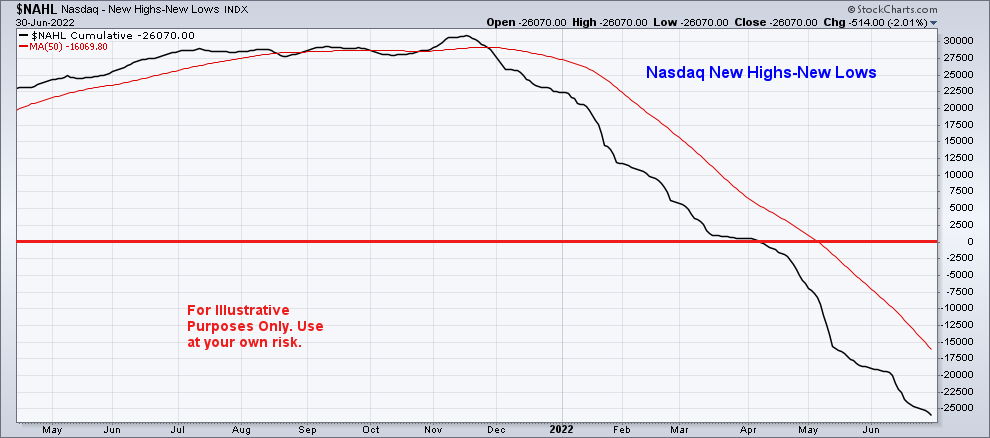
This chart measures the volume of stocks hitting new highs or new lows. This indicator is also below zero and still trending down.
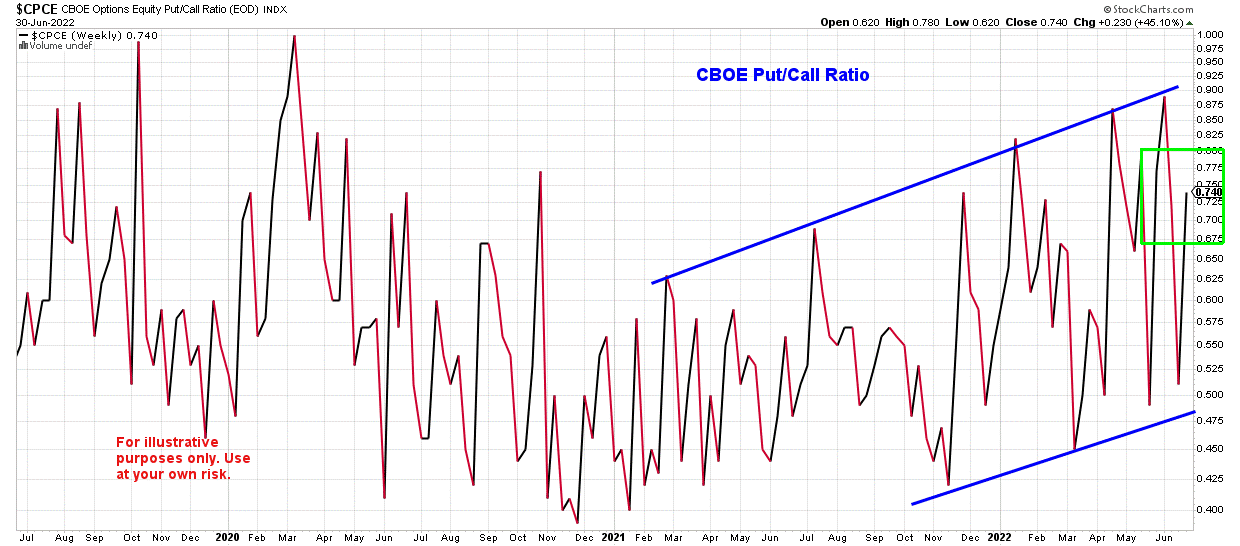
The chart below is the CBOE Put/Call Ratio. It measures the volume of put options bought (traders buy put options expecting the market to go down) versus the volume of call options bought (traders buy call options expecting the market to go up). At the far right of the chart, note that currently the level of puts bought is increasing which indicates that traders on Wall Street are expecting the market to continue its downward trend.
Conclusion
At the moment all the breadth or participation measurements do not seem to indicate that a market bottom has not been reached yet. None of the economic data that has been released recently has been positive, so it’s no surprise that investors and traders are not ready to begin buying stocks again. Typically, the first sign that it’s time to start buying is when these indicators (and other statistical measurements) begin to show divergences from the indexes—meaning the price may still be trending down, but the A/D line—the new highs versus new lows—begins to move in a positive direction. Buyers of call options will outnumber put option buyers as sentiment turns positive again.
As always, the key is to stay patient and calm when others around you are panicking. Feel free to call or email me if you have any questions: 972-772-9599 bret@wilsoninvestmentservices.com