Current Conditions
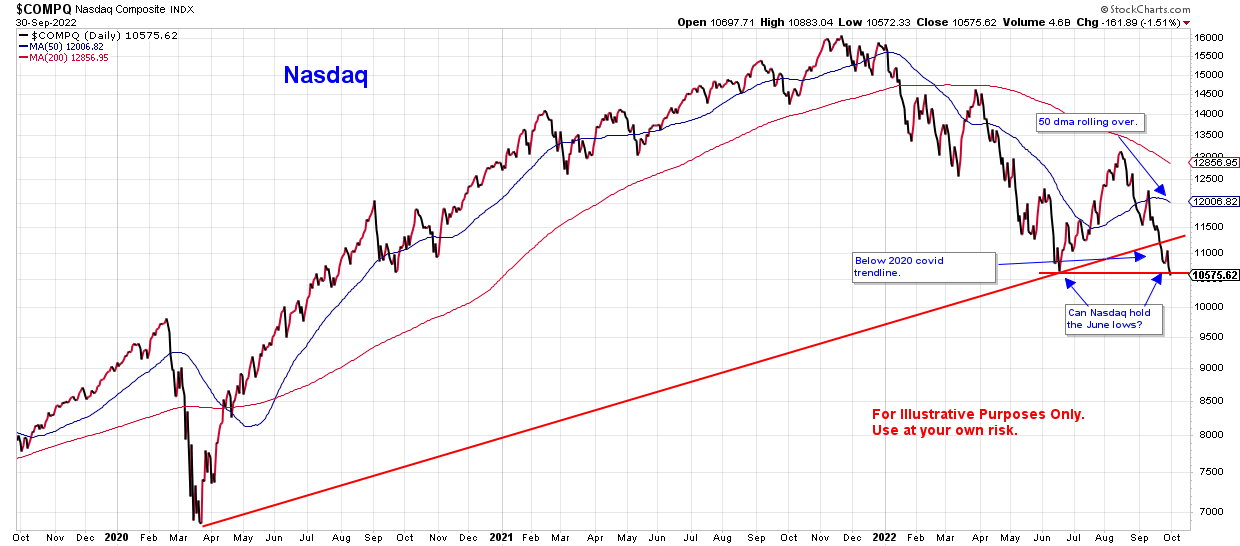
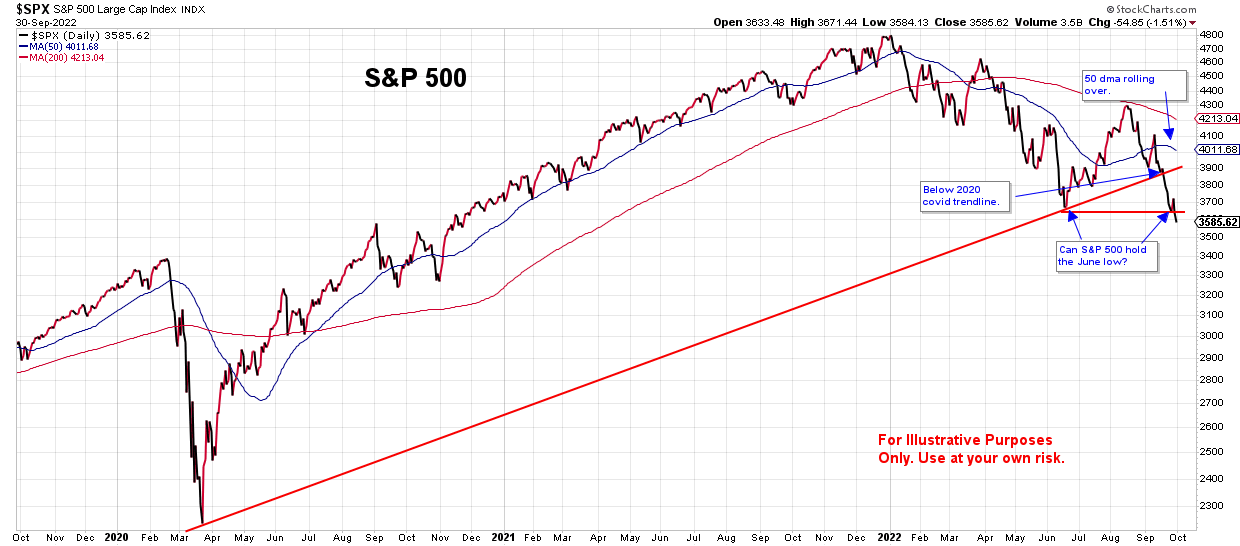
Recently, I have spent a lot of time examining market indexes to identify possible points of support and resistance, and the June lows seem to be a logical point of support. This week the S&P 500 and the Nasdaq indexes both hit that level of support on Tuesday, and both bounced off it on Wednesday as market traders tried to take advantage of some oversold conditions. By Thursday, the sellers were back, and the indexes closed back down at the previous support level. Friday, the indexes were mixed most of the day and looked like they would close near Thursday’s closing prices. But then the last 10 minutes of trading saw intense selling, and many of the indexes closed below their June lows.
Federal Reserve Not Done
For the third straight time, Fed officials raised interest rates by 75 basis points on September 21, bringing the target for the benchmark federal funds rate to a range of 3% to 3.25%. Their quarterly Summary of Economic Projections shows a median forecast of rates being raised to 4.4% by the end of this year. This seems to indicate that there is still 1.00 to 1.25 percentage points more of rising rates during their remaining two meetings in November and December. St. Louis Fed President James Bullard commented on Thursday of this week, “We’re determined to get to the right level of the policy rate in order to put meaningful downward pressure on inflation here.” As a result, I don’t think they will let up until they see some meaningful decrease in inflation, which might be sometime in 2023. Fed projections indicate that rates should start coming down by the end of 2023 and continue through 2025.
What Does This Mean for Investors and Traders?
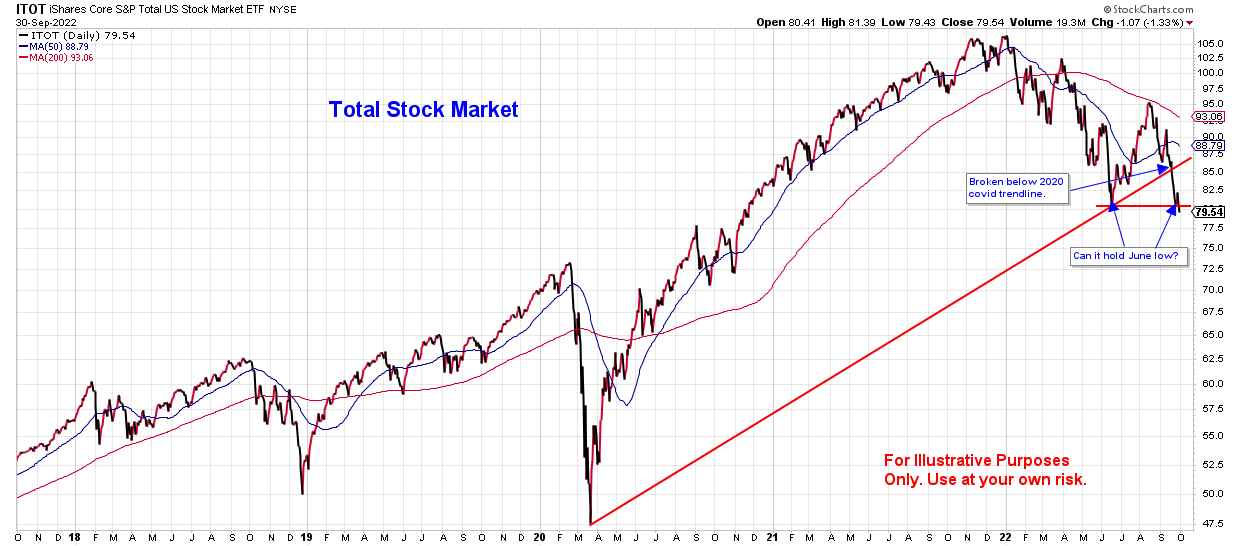
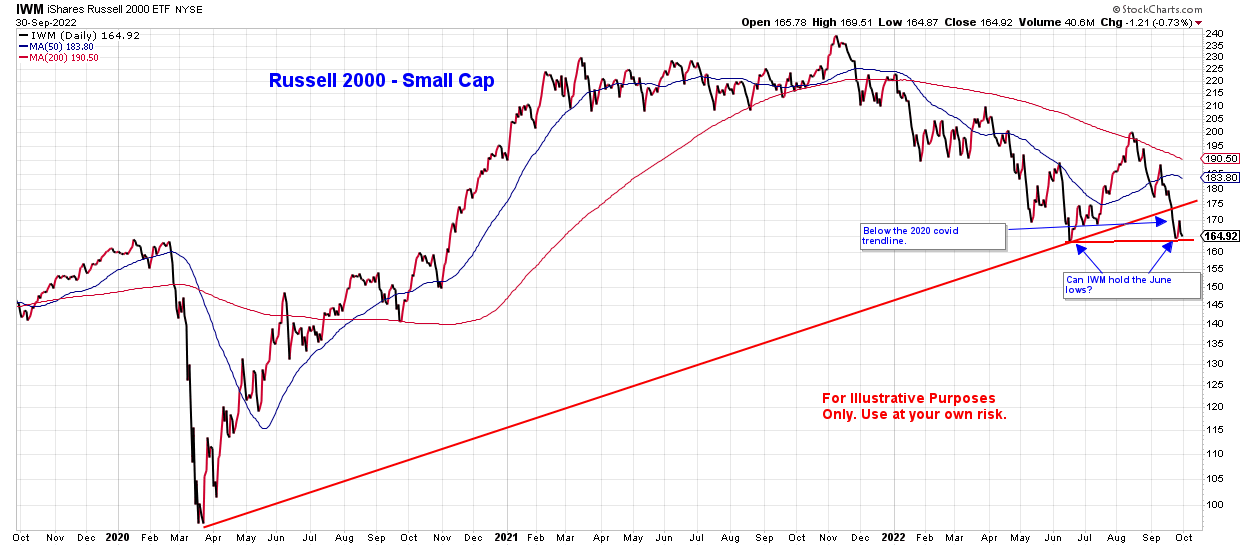
With interest rates almost certainly expected to continue rising through the end of the year—as the Fed continues to fight inflation—there doesn’t seem to be much good news for the foreseeable future, whether you are a short-term trader or a long-term investor. Three of the four index charts below answer the question “Can they hold the June low?” with the answer being a resounding no. Also, all four indexes are below the red, 2020 Covid trendline. The blue, 50-day moving average line in each chart has also rolled over to kill any hopes the summer bull market might have instilled.
Concerning Outlook
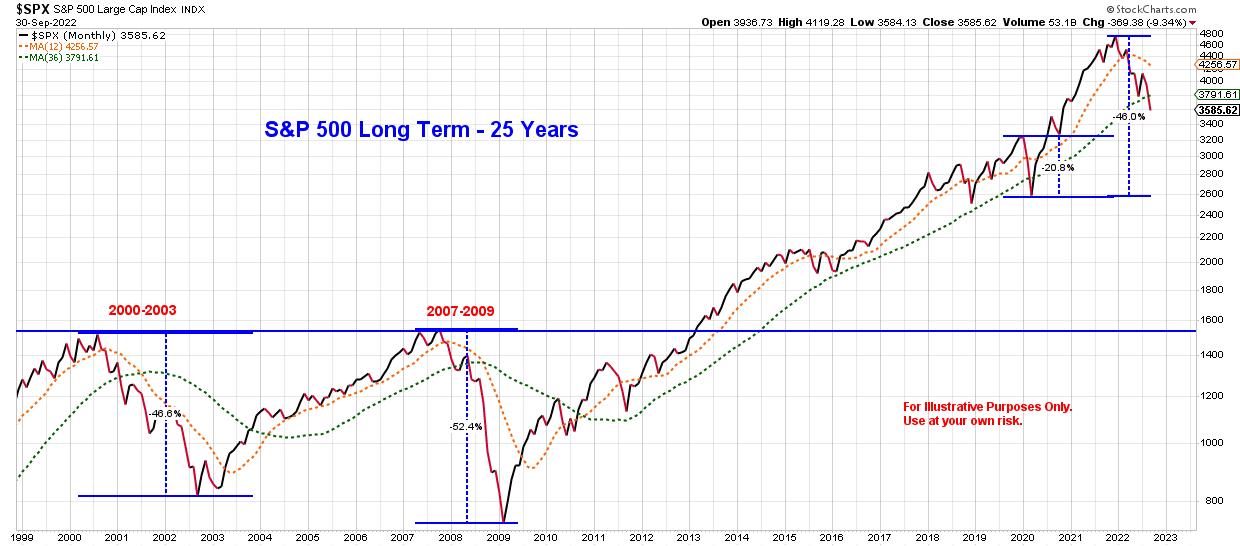
While all this is concerning, I am most bothered by the chart below. This is a 25-year monthly chart with a red, 12-month moving average line and a green, 36-month moving average line. The last time the 12-month moving average line turned down like this was at the beginning of the 2000 dot-com bubble and the 2008 financial crisis. I am certainly not predicting another market crash; I am simply speaking to the probabilities that the markets will struggle through the 4th quarter.
There could certainly be unforeseen events that could turn the markets around, but I can only speak to the evidence that is available to us now. Could the Fed committee change its mind about continuing to raise rates? Sure, but it’s not likely. Remember, it is important to keep an open mind and remain flexible over the coming months so we are in a position to take advantage of low market prices when the evidence points in the other direction.
This post is for informational purposes only. It is not intended as investment advice as each person’s financial situation is different. I strongly recommend working with a financial advisor who can deliver current information to you quickly and offer help with sorting through the various investing options.