Has the Ship Sailed?
As I mentioned in my last blog post, the end of 2023 was epic for investors. That type of breakout can create extreme bullish sentiment and FOMO (fear of missing out) among investors who then jump into the market only to see the indexes begin to move sideways the first two weeks of the new year. That leads to frustration once they realize they missed the boat. So how do you deal with that?
Expectations for 2024
Taking a longer view is critical for investors, so the question we should really be asking ourselves is, what should we expect in the markets in 2024? Since no one can actually predict what will happen next, the best thing to do is try and determine the probability of different scenarios and make decisions based on the highest probability.
Develop Scenarios
One of my favorite bloggers is David Keller, CMT, who writes a blog called The Mindful Investor. He also has a YouTube channel called Market Misbehavior. David recently posted an article on StockCharts.com talking about “probabilistic analysis” where he laid out some scenarios for the 1st quarter of 2024. I’m not going to go through the whole post, but I’d like to hit a couple of highlights. Keller encourages investors to consider different scenarios for the coming months and try to determine the probability of each scenario occurring. This is an important component to helping investors combat recency bias, or FOMO.
Technical analysis is one of the pillars needed to examine potential scenarios, which is why I often insert charts into my blog posts and will do so again today.
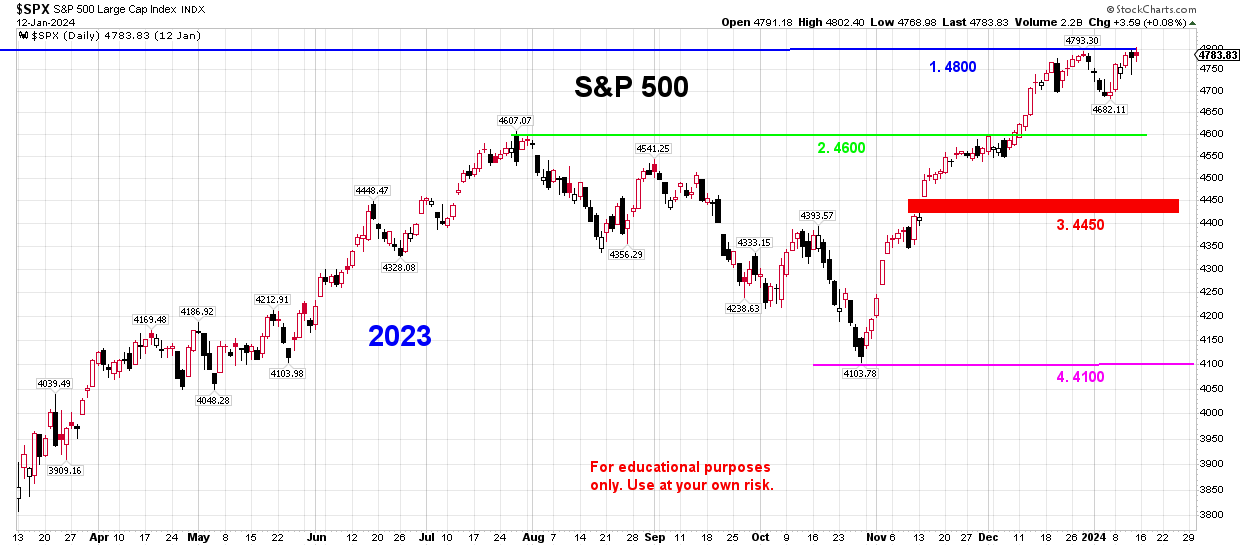
Below is a daily chart of the S&P 500 that will give us a visual representation of where we have been and where we might be heading. There are four different price levels that stand out which can help us create scenarios. Keep in mind that statistically speaking, the 1st quarter of an election year is usually bearish.
- 4800 – Jan 2022 high – Can we break out above this? What factors would cause this to happen? One might be a spectacular earnings season that has just started.
- 4600 – July 2023 peak – This 3% to 4% pull back becomes the first level of support for the S&P 500. Maybe investor sentiment decreases some as the market takes a breath.
- 4450 – Nov 2023 S&P gaps higher – Typically if the markets open up a trading day by gapping up, this signals some new positive information has come out and Wall Street begins a massive buying effort. These gaps have tendency to get filled when the market pulls back. A fall below 4600, and the likelihood of this gap filling at 4450 increases, and this is the new support level. This would be a 7% pull back. This lines up with what typically happens in the 1st quarter of an election year.
- 4100 – Oct 2023 bottom – This would be a 14% pull back. If there is a poor earnings season and the Fed revisits raising interest rates again, then we could see this scenario occur. This would completely erase the recent breakout.
Something to Watch For
- The Fed is making noise about raising rates, but unless inflation takes off again, it’s not very likely.
- Investor sentiment is currently bullish. The CNN Fear/Greed Index closed at 71, which is heavily into the Greed sector.
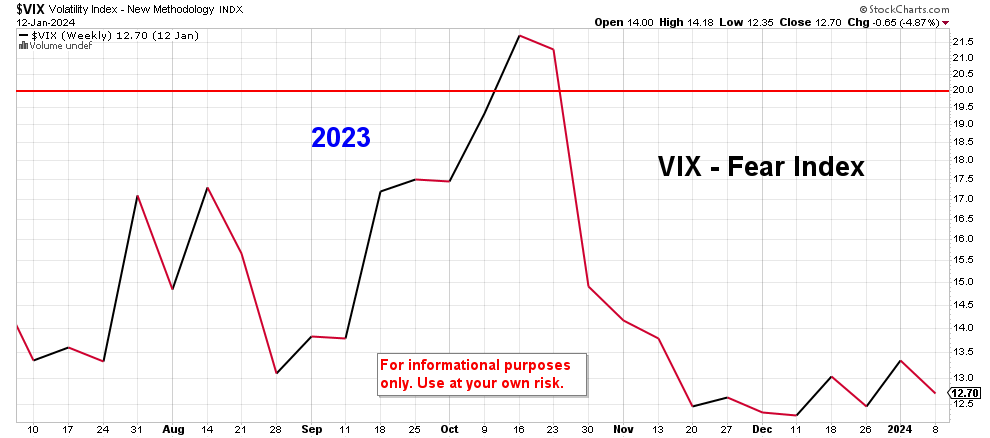
- The CBOE Volatility Index (VIX) pictured below, continues to stay well below 20, which could mean stock prices continue to go up. If the VIX goes up, that means option traders have a negative outlook on the market and selling begins.
Election Year
Considering that the markets corrected heavily in 2022 and inflation has slowed, the likelihood of another major correction is low. Also, history shows that in presidential election years, the market has been positive 19 of 23 times (83%). The average return during those 23 years was 11.28%. Stay above the noise this year and pay attention to the things that matter when it comes to your portfolio.
________________________________
This post is for informational purposes only. It is not intended as investment advice as each person’s financial situation is different. I strongly recommend working with a financial advisor who can deliver current information to you quickly and offer help with sorting through the various investing options. Bret Wilson is a Financial Advisor with Wilson Investment Services, based in Rockwall, Texas.